Trading Chart Patterns: Top 15 Types of Chart Patterns Every Trader Must Know
- Updated on : May 23, 2026
- 7523 Views
- by Manaswi Agarwal

 Instagram
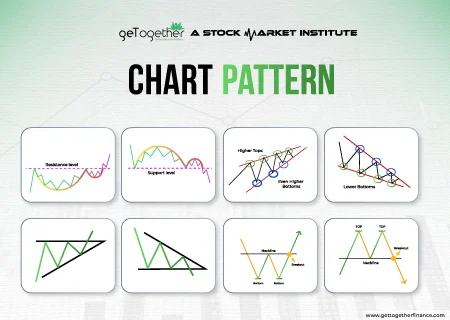
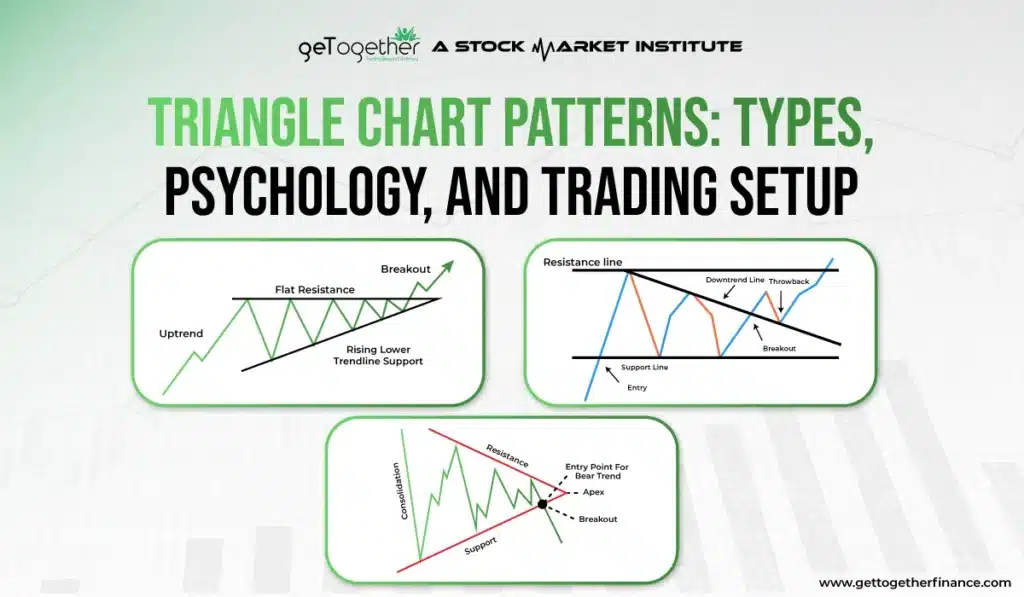
Chart Patterns are used by traders to conduct technical analysis which is beneficial to determine the prices of assets. The patterns are recognised as they form different shapes through which the behavior of buyers and sellers is predicted. It gives an idea about the trend and market movements.
What are Triangle Chart Patterns in Trading?

Triangle chart patterns are a primary tool within technical analysis, helping traders identify effective price movements based on historical data. Different shapes that are created on the price chart over a time period are known as chart patterns. They are basically made by connecting highs and lows with trendlines. There are three different types of chart patterns: reversal, continuation, and bilateral patterns, which we are going to discuss below.
Importance of Stock Chart Patterns in Technical Analysis
Chart patterns in the share market play an important role because they provide objective or structured methods to the traders. These techniques help them in making trading decisions.
- Predict Price Moments: With the aid of chart patterns, traders can forecast the stock price based on historical information.
- Implement risk management: The primary function of a trading chart pattern is to establish accurate points for controlling risk. These points are stop-loss placement and risk or reward calculation.
- Visualise market psychology: In trading, every pattern is a visual representation of a fight between buyer (demand) and seller (supply), which shows where the support and resistance level are.
- Define entry and exit/target points: An entry point signifies that the price is breaking out of the pattern, which means breaking above the resistance line. An exit point is the predetermined market conditions at which traders sell stock to gain profit.
Pro Tip: Only use a reversal pattern if trading decisions like entering or managing a trade are aligned with a higher timeframe.
Different Types of Chart Patterns in Trading That Every Trader Should Master
Within trading, there are different types of chart patterns, and below, all these have been described in detail.
1. Head and Shoulder Pattern

Head and Shoulder Chart pattern is formed after an uptrend that contains three consecutive successive peaks: the middle one being at the top while the other two at the sides are almost equal. The two peaks at the sides are the shoulders that are formed on the neckline. The head is considered as the highest peak in the middle. The neckline or the support line connects the lows of each peak.
The neckline can have an upward slope, downward slope or be horizontal. This slope of the neckline determines the degree of bearishness that the pattern has. The downward slope of the pattern is more bearish as compared to the upward slope.
Because of its predictive nature, the Head and Shoulder pattern is frequently analyzed in trading education, including in an option trading course, where identifying such reversal signals can help in making more informed decisions about entry and exit points.
2. Inverse Head and Shoulder
It is basically a bullish pattern that showcases an inverse head and shoulder pattern. In this, there are 3 stages which are the left shoulder, head and right shoulder. In the left shoulder, the price goes down and then bounces back. While within head, the price goes down again even lower than the left shoulder and then increases. Whereas, in the right shoulder, the third time price goes down but this time, it is higher than the head and moves upward.
There is up to 60% to 70% chances of inverse head and shoulder pattern to reach price target in weekly charts.
3. Double Top and Bottom Pattern
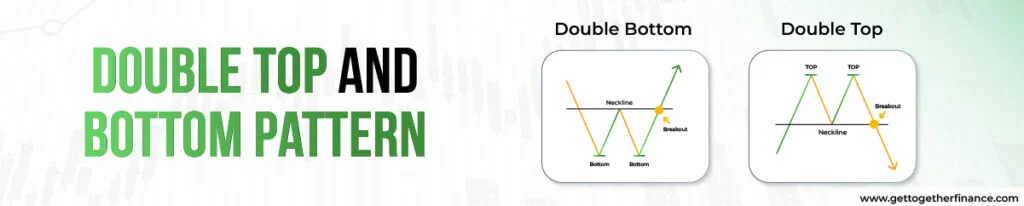
Double Top Pattern
Double Top chart pattern signifies a bearish reversal pattern which takes place after an uptrend in the market. The pattern can be represented by forming an “M” shape. The formation of this pattern implies that the selling pressure in the market is strengthening and that the trend will get reversed soon. The double top pattern contains two peaks which are roughly equal in height, having a trough in between them. The pattern gets completed when the price breaks below the support level or the resistance level which got established during the trough.
This type of pattern is commonly used by traders to identify potential exit points and manage risk more effectively. Understanding how to apply such reversal signals in real market conditions is often covered in the best stock market courses, where the focus goes beyond pattern recognition to strategy and execution.
Double Bottom Pattern
It is opposite to the double top pattern that depicts a bullish reversal pattern that takes place after a downtrend in the market. It can be seen as a formation of “W” representing two troughs at the sides with a peak in the middle. The pattern is completed when the price breaks the resistance level i.e the neckline which connects the two peaks between the troughs. This pattern signifies that the buying pressure is strengthening which might soon reverse the trend.
4. Triple Top and Triple Bottom
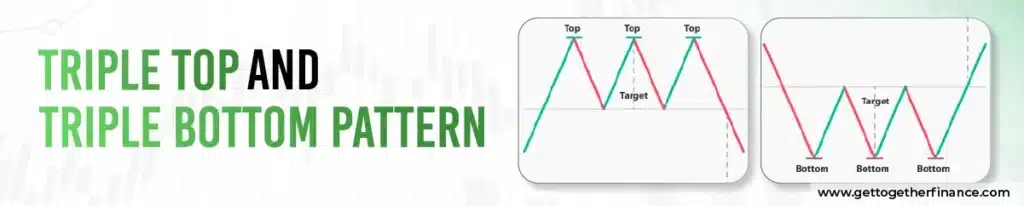
The triple top or bottom are the most effective and powerful reversal stock market chart patterns which are used in technical analysis to showcase a crucial change in movement of prices.
Triple Top
The triple top is the bearish reversal which reveals that the market direction is changing from going upward to downward. This outlines an uptrend in which the prices of stock try to break above the support level 3 times back to back and goes down. This continuous failing shows a loss of purchasing power and increasing seller control. Also, a downturn indicates when the price breaks below the neckline.
Triple Bottom
The triple bottom is a bullish reversal which is made after a downturn. The price strikes the resistance level 3 times without breaking it which signaled that sellers are losing momentum and buyers are coming into the market. When the price positively breaks above the neckline, it signals a downtrend.
5. Rounding Bottom

A rounding bottom is a share market chart pattern that is used in technical analyses to showcase a main reversal trend. In this, there are mainly 3 phases which are downtrend, bottom and breakout. Within the downtrend, the price is falling, while at the bottom, the price goes down slowly, stabilizes and starts rising. The price continues to go upward in a breakout and breaks the above high point which shows the end of the downtrend and starts of a new uptrend.
6. Cup and Handle Pattern
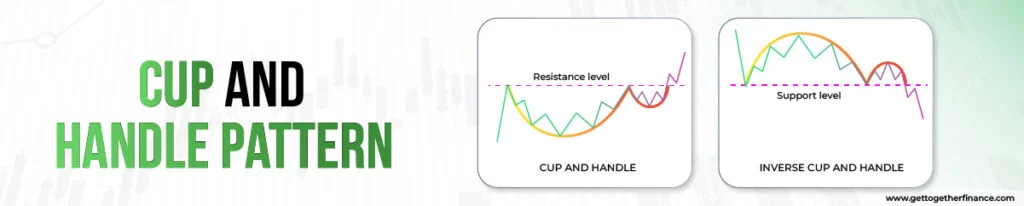
Cup and Handle chart pattern occurs during an uptrend in the market representing a bullish continuous pattern that excites the trader. The cup looks like a bowl which is “U” shaped where most of the time the two highs will be equal on both sides of the cup. After forming the shape of a curve, the price takes a downturn that represents the handle of a cup. The price breaks out from the handle which is then marked as a bullish trend in the asset.

Wedges are formed between two sloping trend lines which can depict a rising as well as a falling movement. There are two types of wedges i.e. rising and falling.
7. Rising Wedge
The two trendlines with an upward movement with slanted lines of support and resistance represents a rising wedge. In a rising wedge, the price breaks down below the support level which indicates a bearish movement.

8. Falling Wedge
Falling Wedge is a downward slope that is wide on the top and contracts as it comes closer because of decreasing prices of the asset. Falling wedge is the reaction of high and lows that contacts as the price moves down. The two trend lines are formed on the highs and lows indicating a falling wedge. The price then breaks the resistance level in upward direction and hence gives a bullish phase to the pattern.
Both the patterns are reversal where the rising wedge represents a bearish market whereas the falling wedge represents a bullish market.
9. Flags
Flags are the most effective and genuine stock market chart patterns within technical analysis which show a break before the trend continues. It includes two crucial parts which are the pole and the flag. The pole is the strong or quick price movement that sets up the present trend either down or up. Whereas, the flag is a tight, small or rectangular pattern, which slopes against the direction of the earlier trend. In a bullish pattern, the flag slope is down and within a bearish pattern, the flag slope is up.
10. Pennant
A pennant indicates a short break in a forceful trend before the trend is expected to resume. It comprises two vital parts such as the pole and the pennant. The pole is a fast, strong and vertical price movement that places the pattern’s direction. While the pennant is a tight or small combined area that appears after the pole.
11. Rectangle
A rectangle is made when the price of stocks moves sidewards between two horizontal or parallel trendlines. This pattern reveals that the price is presently resting or moving after a forceful upward trend.
12. Symmetrical Triangle
A symmetrical triangle is the famous share market chart pattern that highlights indecision and market consolidation period which result in breakout. Within this pattern, there is a tension between seller or buyer that leads to a decreased price range.
“Do not anticipate and move without market confirmation—being a little late in your trade is your insurance that you are right or wrong.” says by Jesse Livermore
13. Broadening Formation
Within this, every fluctuation in price makes a higher peak and a lower trough which shows increasing clashes between seller and buyer. Also, bulls are ready to buy at a higher price and bears are willing to sell at a costly price.
Also Read: Wedge Pattern
14. Diamond Top/Bottom
The diamond top and diamond bottom are majorly viewed as reversal patterns within technical analysis, asymmetrical patterns. Both of them highlight an upcoming shift in the dominant market. They are studied as rare but powerful patterns.
Diamond Top
It is a bearish reversal pattern. This pattern is formed after an uptrend. It starts with a widening formation and then changes into a contracting formation. The diamond top presents a period of unpredictability and conflict between buyer and seller at a high price point.
Diamond Bottom
It is a bullish reversal pattern. This pattern is formed after a downtrend. It begins with a narrowing formation and is followed by a widening formation. The diamond bottom pattern shows prices going down and buyers buying stocks.
15. Candlestick Patterns
Candlestick patterns are the basic concept within technical analysis used in the stock market. It is a particular formation or order of one or more candlesticks on a price chart that traders use to forecast future price movements. Traders examine the length of the wicks, bodies, and color to measure the psychological balance between selling and buying pressure. There are 3 types of candle patterns:
- Single-candle patterns.
- Double-candle patterns.
- Triple-candle patterns.
Pro Tip: Entering a trade before the breakout is confirmed results in losses.
Limitations
Chart patterns such as head and shoulder, double top and double bottom, and wedges are quite popular which are used by many traders to determine the price action. These patterns lack authenticity because these are very easy to identify. Because of its wide usage, a trader or investor cannot completely rely on chart patterns and requires advanced technical analysis techniques like demand and supply theory for increased probability.
Common Mistakes Traders Make with Chart Patterns

Traders usually make numerous mistakes while using trading chart patterns which include the following:
- Ignore Big Picture: Not considering market trends while analysing patterns is a main drawback.
- Neglect Confirmation: Entering a trade without confirming the pattern is an expensive mistake.
- Subjectivity and Misidentification: If the trader fails to distinguish between different chart patterns and assumes that a pattern fits into current market trends can lead to losses.
- Poor Risk Management: If traders are not properly managing the risk then they face significant problems.
How To Trade Chart Pattern Effectively

Here are some guideline and by following them trader can effectively trade chart patterns:
- Identify the Pattern and its Context: Whether it is reversal, continuation or bilateral, a trader has to identify which direction is indicated.
- Wait for the Confirmed Breakout: Trading chart pattern is not complete till the price positively breaks out of its support line.
- Confirm the Breakout with Volume: In a strong breakout, the price break occurs on high volume whereas in a weak breakout, the price break takes place on low volume.
- Set Trade Parameters: To manage the risk, traders need to set stop-loss and determine target profit.
- Use Multiple Timeframes: Traders have to use lower and higher timeframes as per their needs.
Tools To Spot Patterns Automatically

The best tools that automatically point out patterns are
- Technical analysis platforms and screening
- AI-powered charting and analysis
These tools use algorithms and machine learning to identify chart patterns
Read More : Stock Chart Patterns: How to Spot?
On a Final Note
Chart patterns can be helpful in trading but do not follow 100% accuracy which is why GTF follows its own “Demand and Supply Theory” for trading purposes which is much better and reliable. A trader must be familiar with these chart patterns as they are used in the financial market but should be dependent on his own research and analysis.
FAQ
How are charts formed?
Chart patterns describe the price movements over a period of time. These patterns help traders to identify and analyze the future market movements.
Can I rely on chart patterns for trade?
You should be able to conduct in depth analysis before completely relying on the chart patterns. While these patterns can help additionally to predict a bearish or a bullish market movement.
How do chart patterns work?
The chart patterns aim to provide you with insights about the breakout in a trend. After proper research about the chart patterns, investors/ traders can analyze the movement of price in an asset through breakouts or breakdowns.
What are wedges?
Wedges are the chart patterns formed between two sloping trend lines that indicates a rising as well as a falling movement.
How to identify a chart pattern?
Chart patterns are identified by the trend lines which are formed by joining the highs and lows of the prices.
Which chart pattern is best for trading?
There is no single chart pattern that is best because it majorly depends on the stock, timeframe and market conditions.
Which chart pattern has the highest accuracy?
The chart pattern of inverse head and shoulder has cited the highest accuracy.
Which chart pattern is most successful?
There is no single chart pattern that is successful as it depends on several components like market context and trade execution.
What timeframes are best for trading chart patterns?
The higher timeframe is considered best for trading chart patterns.
Is it possible to automate best pattern recognition?
Yes, it is possible to automate the best pattern recognition.


