
ADX Indicator (Average Directional Index) – The Trend Strength Indicator
- Updated on :
- 858 Views
- by Suhani

 Instagram
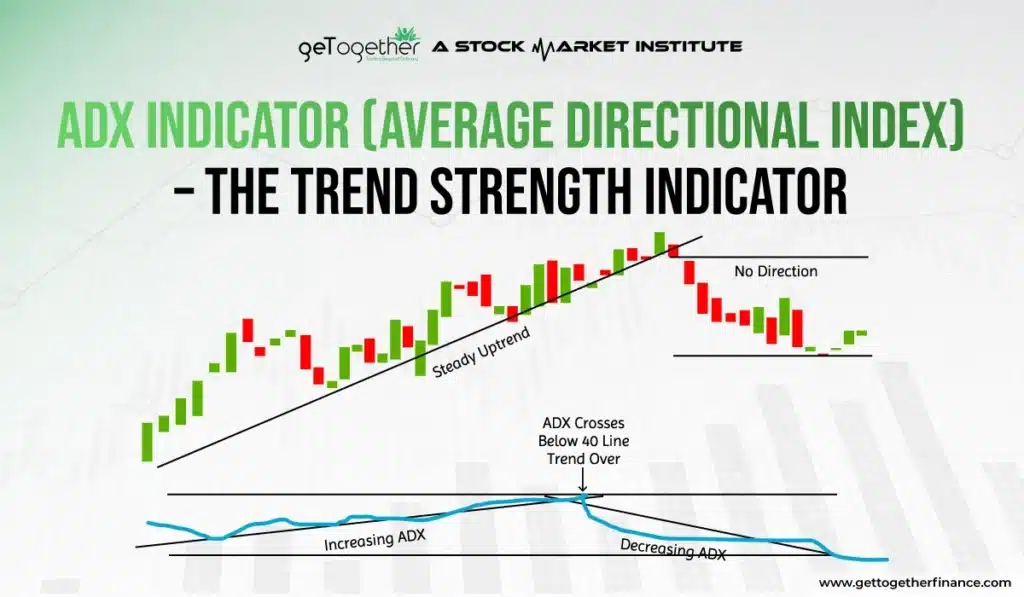
ADX, full form Average Directional Index, is a technical indicator that is used by traders to know the strength of trends, but not their direction. It simply helps traders to know if the price is in a strong trend or not. The direction is not conveyed by the indicator.
This indicator is part of the directional movement system developed in the 1970s by J. Welles Wilder. Now, ADX is also divided into two other indicators: a positive directional indicator (+DI) and a negative directional indicator (-DI).
This indicator can be helpful for traders in knowing trend strength, and it further helps in taking trades based on it. It helps traders know whether the market is trending currently or consolidating. In short, ADX helps traders avoid false signals and focus on high-probability setups. Let’s dive deep into this blog and learn more about this indicator.
ADX Indicator
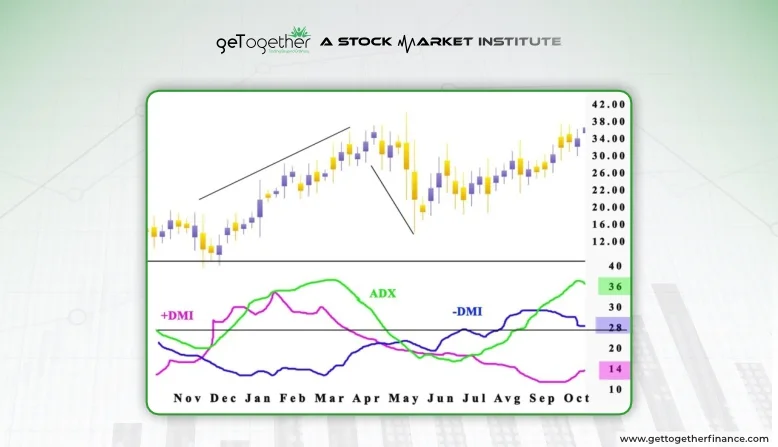
ADX indicator can be added adjacent to the candlestick charts, and it is a graphical representation with 3 core lines. When you look at all three lines together, they show how strong the trend is and where it’s headed. Here’s what the ADX indicator is composed of:
- The ADX Line
The first and major line of the ADX indicator is the ADX line; it measures the strength of the current price trend. The value of this line is from 0-100. A higher value of the line means the trend is strong, and a lower value shows that the trend is weak. But no direction is shown by this line.
- Positive Directional Indicator (+DI)
The +DI line shows the strength of upward price movements that are happening in the stock. When this line is higher than -DI, it means that the stock is having good demand and an uptrend is there.
- Negative Directional Indicator (-DI)
The -DI line shows the strength of downward price movements that are happening in the stock. When this line is trading higher than the +DI line, it suggests that the stock is in great supply, sellers are in control, and the market is in a downtrend.
How These Components Work Together
All three of these lines graph together to form the ADX indicator. ADX line measures trend strength, while the other two help in showing trend direction. Combining these, traders can decide whether to buy the stock or sell. For example, if +DI is above -DI and ADX is rising, it signals that the price is in a strong uptrend.
How ADX is Calculated
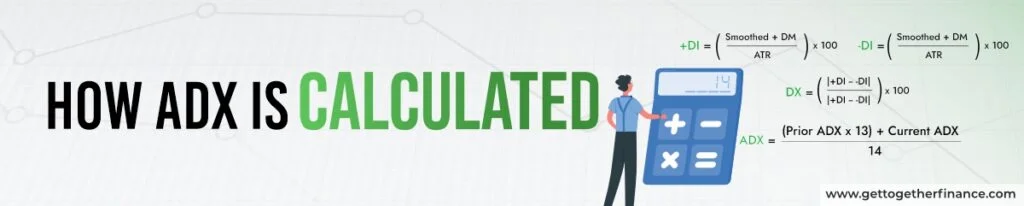
To find the strength of a trend, ADX uses price data and runs it through a formula based on directional movement and True Range. Here’s how ADX is calculated with these 3 steps:
- The first step is to find directional movement (DM):
- Compare today’s high made by the price to yesterday’s high for +DM
- Compare today’s low made by the price to yesterday’s low for -DM
- Then take into consideration, or use only the larger value in both cases; if neither is large, then consider the value zero
- The second step is the True Range
Here’s how the TR is calculated:- Today’s high minus today’s low.
- Today’s low minus yesterday’s close.
- Today’s high minus yesterday’s close.
- Here’s how ADX is calculated
- Divide +DM and -DM by the TR you calculated to get the +DI and -DI


- Find the difference between and sum of +DI and -DI, then calculate their ratio:


- Now, the next step is to calculate the Directional Index (DX), here’s its formula:

This ratio will help you understand how strongly one directional graph dominates over the other.
- At last, the DX values are averaged for a specific period, usually 14 days. The formula for this is:

Each day, the oldest DX value is replaced with the newest one to keep the calculation dynamic.
Note: All of this calculation is automated, and you don’t have to do it yourself. Charting software like Trade Tiger and TradingView offers ADX indicators for free. You can access it from the indicators drop-down box.
Using the ADX Indicator in Trading

The ADX indicator is used by many traders to find a good trade setup. This helps traders spot whether the market is trending strongly or staying range-bound. By combining ADX with +DI and -DI, traders can also get an idea of the direction and strength of the current trend.
Here’s how conventional traders use it effectively:
1. Identifying Strong Trends
Traders use ADX to know whether the market is in a strong trend or not with the help of the ADX line. When the ADX line:
- Trades in the range of 0-25: Weak or no trend; more likely a sideways trade
- Trades in the range of 25-50: Moderately strong trend
- Trades in the range of 50-75: Indicates a strong trend
- Trades in the range of 75-100: Indicates a very strong trend.
All these help in just knowing the strength of the trend, so traders can check whether the current price momentum is going to survive or not.
2. Using ADX Indicator with Other Strategies and Indicators
ADX indicators alone don’t work best, but with other indicators, their accuracy increases
- With Moving Averages: If the trend confirmed by ADX is also highlighted by EMA and SMAs, then it is a green signal.
- With RSI (Relative Strength Index): The overbought and oversold situation confirmed by RSI, when used with knowledge of ADX, then traders can find more reliable trades
- With Demand and Supply Theory: All these indicators were previously used by conventional traders, but to keep up with the dynamic stock market like today’s, a powerful theory like demand and supply is needed. Using ADX in conjunction with demand and supply can be an add-on to the trade. If the strong uptrend aligns with a good demand zone, then it is a green signal for a long trade. Whereas the strong downtrend aligns with a good supply zone, it is a good signal for a short trade.
3. Entry and Exit Signals
The ADX, along with its other two lines, +DI and -DI, can help traders know when to enter and exit the trade.
- Buy Signal: When +DI is above -DI and ADX is trading in the range of 75-100
- Sell Signal: When the +DI line is below the -DI line and the ADX line is in the range of 75-100
- Exit Signal: If ADX lines start falling suddenly, it means that the price trend is weakening.
Limitations of ADX

While ADX is said to be a helpful trading tool, it’s still not up to the dynamic nature of the current stock market. It has certain limitations that traders should know before relying on it solely:
The lagging Nature of ADX
The nature of ADX is not based on real-time data; instead, the graph is made from past data, so real-time changes take time to reflect on the chart. This delay can make it a slow process for sudden market changes and reversals, eventually ending up in missed opportunities.
ADX Values can be Misinterpreted
The ADX indicator only indicates the trend strength and not its direction. This can be confusing for traders who don’t take into consideration -DI and +DI. It is important to read all three lines together; a high ADX can be deceiving. It may be an indicator of a strong uptrend or strong downtrend, but nobody can tell.
Conclusion
The ADX indicator is an important and widely used indicator by traders. It helps them in understanding the strength of the current price trend. By using the ADX line, +DI line, and -DI line together, traders can make good trading decisions. It also helps in planning apt entry and exit points. It works best when used alongside a strong theory like demand and supply and reliable indicators like EMA, RSI, etc.
Nevertheless, it is extremely important to remember that the ADX is a lagging indicator, which means it reflects past price movements, and it doesn’t provide real-time updates. It is important for traders to remember this rule. ADX indicator should be used mindfully and never alone. It is only a good add-on in a strategy, not a complete strategy.
Frequently Asked Questions
What does the ADX measure?
The ADX evaluates the strength of a trend, whether upward or downward. It does not show the trend’s direction, but it does help traders determine if the market is trending strongly or meandering sideways.
What are the key components of the ADX indicator?
The ADX contains three lines:
The ADX Line demonstrates the strength of the trend.
The +DI Line represents the strength of upward price moves.
The -DI Line represents the strength of downward price swings.
What is a strong ADX value?
0–25: Weak or no trend.
25–50: Moderately strong trend.
50–75: Strong trend.
75–100: Very strong trend.
Can the ADX be used alone?
To improve accuracy, the ADX is best used in conjunction with other indicators such as moving averages, RSI, or support and resistance levels.
What are the limitations of the ADX?
ADX is not real time indicators, its information is based on previous price data, so it lags in real time. Also, it does not show trend direction without the +DI and -DI lines.



