
Best Demand and Supply Indicator (2026): GTF Indicator 2.0 Full Review and Features
- Updated on :
- 807 Views
- by Suhani

 Instagram
Overview: Why Manual Demand and Supply Zone Marking Fails Traders
In the stock market, finding the demand and supply zones is crucial because they help traders understand where the price may reverse or continue. However, it takes a lot of time to manually mark the zones on every chart, especially when analyzing multiple stocks. It may also cause errors, leading traders to miss valuable opportunities.
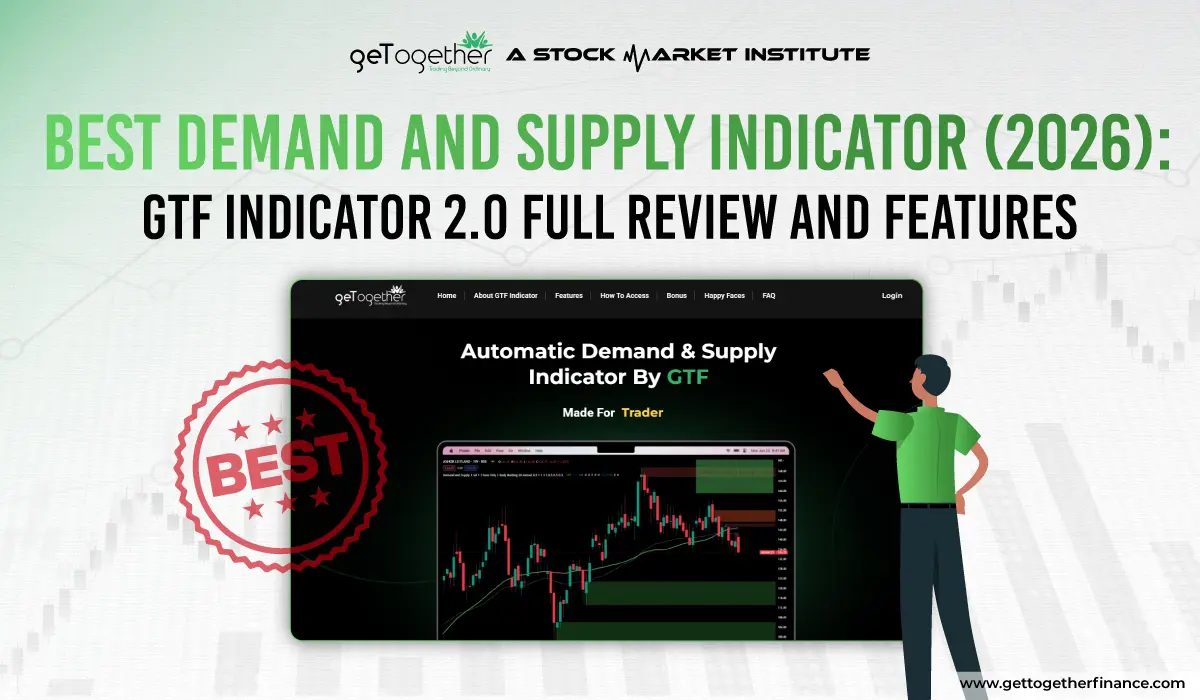
The GTF Indicator fixes this problem by automatically marking demand and supply zones on the chart. This makes chart analysis more accurate, faster, and easier.
This blog covers why the GTF Indicator 2.0 is one of the best demand and supply indicators and how it can level up your trading.
Why Technical Indicators Matter for Spotting Demand and Supply Zones
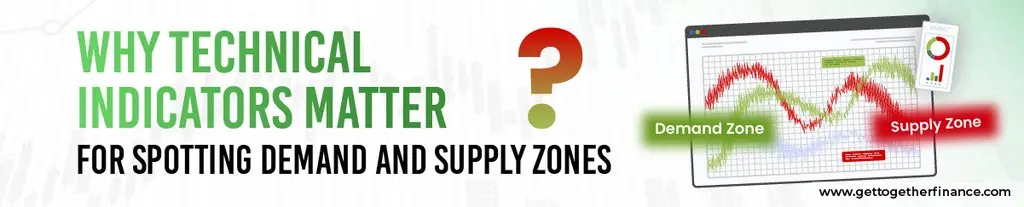
Technical indicators for trading help traders understand price movements and spot good buying and selling opportunities. But using multiple indicators can clutter charts and slow down the analysis.
This is where a demand and supply indicator helps. The GTF Indicator 2.0 automatically marks key demand and supply zones. This makes chart analysis much easier, saves time, and reduces mistakes.
Whether you are a beginner or an experienced trader, it can help you make faster and more confident trading decisions. This makes it one of the best demand and supply indicators for traders.
If you want to explore more technical indicators for trading, you can also read our Top 10 Indicators for Trading blog.
GTF Indicator: Built on the Demand & Supply Theory
The GTF Demand and Supply Indicator is an advanced version of the Demand and Supply Theory developed by GTF founders Arun Singh Tanwar and Sooraj Singh Gurjar. After extensive research and testing across different market conditions, they crafted this theory to simplify trading for everyone. Here’s what makes it unique:
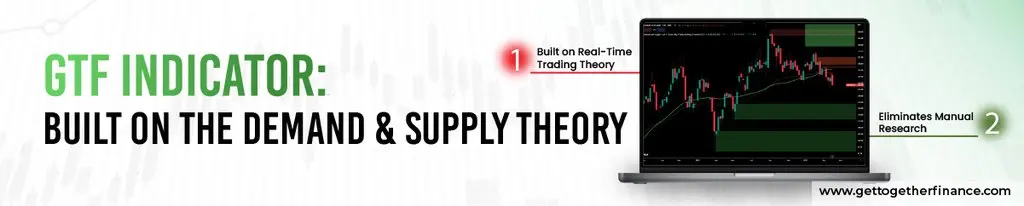
Built on Real-Time Trading Theory: Unlike most indicators based on complex mathematical algorithms, the GTF Indicator integrates institutional trading patterns with top indicators like EMA, SMA, and DMA. This blend ensures a comprehensive approach to market dynamics.
Eliminates Manual Research: Manually marking demand and supply zones can be time-intensive, requiring deep research and understanding. The GTF Indicator automates this process, making it accessible to traders with limited time.
Perfect for Part-Time Traders: With GTF’s Indicator, traders no longer need to monitor charts constantly. Simply set alerts for price points within marked zones, and take action when the time is right.
A Tool for All Markets: It doesn’t matter if you trade equities, options, or commodities; the GTF Indicator is a flexible tool, and it adept to various asset categories, studying candlestick charts. Its versatile nature makes it a must-have for traders to use.
Why Demand and Supply Zones Matter for Entry & Exit Timing

Based on the science of business, demand and supply zones are some of the key areas on the chart where a stock price makes a major move after a tug-of-war between buyers and sellers.
- Demand Zone: It’s where buyers rule, causing upward pressure on the price, just like a “buying hotspot.”
- Supply Zone: This is where sellers dominate, pushing the price downward—essentially a “selling hotspot.”
Spotting these zones accurately can help traders make better entry and exit decisions. The GTF Indicator automates this process, making it accessible even to part-time traders.
Key Features of the GTF Demand & Supply Indicator (10 Features Explained)
The GTF’s Demand and Supply Indicator is an all-in-one solution because of its combination of powerful features, automation, and ease of use. Here are the key features that make it a staple for all traders:
1. Automatic Demand & Supply Zones
With just a click, the GTF Indicator automatically plots demand and supply zones on the chart. These areas are important for making decisions on when to buy or sell. This can save you time on fundamentals so you don’t miss trading opportunities.
2. SMA50 for Trend Detection
The GTF Indicator automatically detects trends based on the Simple Moving Average (SMA50) and displays them at the top of the chart. This helps traders quickly understand the current market direction without checking the trend manually.
3. In-Built Moving Averages (EMA20, EMA50, DMA200):
One of the most interesting features this tool offers is its built-in moving averages function. The indicator has options of Exponential Moving Averages (EMA20, EMA50) and Dynamic Moving Averages (DMA200), giving traders added confirmation on market trends while improving overall signal accuracy.
4. Body-to-Wick and Wick-to-Wick Marking
The GTF Indicator allows traders to mark demand and supply zones using body-to-wick and wick-to-wick price action. This gives traders the flexibility to see how price moved while a zone was forming.
5. Customizable Zone Selection
The GTF Indicator allows traders to customize the base candle used for zone detection. Based on the selected candle type, the tool automatically identifies and plots the relevant demand and supply zones on the chart. This allows traders to analyze zones based on their own trading style, without plotting them manually.
6. Golden/Death Crossover Detection
Another advanced feature of the GTF Indicator is its ability to automatically detect Golden and Death crossovers. Traders consider these crossovers key signals for upcoming bullish or bearish trends, giving you an early view of potential reversals.
7. Automatic Historical Zone Detection
The GTF Indicator automatically finds previous demand and supply zones, giving traders a look at past price levels. It can be quite helpful in marking strong support and resistance areas, making it easier to plan trades based on past price behavior.
8. Boring Candles Identification
The tool even helps in identifying “boring candles,” which show little to no price movement. This helps traders avoid stocks with stagnant prices and focus on more active markets. By spotting these candles on the chart, traders can easily notice times when the market isn’t moving much and avoid trading when price movement is low.
9. Volume Analysis
Volume is one of the essential approaches in technical analysis. The GTF Indicator shows the live candle’s volume and compares it with previous candles. It can help traders review market strength and check whether a price move is likely to continue or reverse.
10. Current Trend Display
Most importantly, the indicator shows the current trend of a stock or index at the top, giving a quick view of the current market mood. Traders can use this information as part of their overall chart analysis, instead of studying the trend separately. This makes it easier to understand the market before planning a trade.
What Makes the GTF Indicator the Best Demand and Supply Indicator?

Beyond its accuracy, advanced features, and versatile nature, here are a few additional qualities that make the GTF Indicator special and the best demand and supply indicator in the stock market:
1. Precision in Trading: Unlike generic indicators, the GTF Indicator focuses on demand and supply zones, which are critical for identifying potential reversal points. It ensures traders are not chasing trades blindly.
2. Ideal for Part-Time Traders: If you’re someone who trades part-time or juggles trading with a full-time job, this indicator is perfect. Its automation saves you hours of manual analysis while still delivering professional-grade insights.
3. A Tool for All Markets: Whether you trade equities, options, or commodities, the GTF Indicator adapts to various asset classes. Its versatility makes it a must-have for traders across the board.
GTF Indicator 2.0 vs. Other Demand and Supply Indicators (TradingView Comparison)
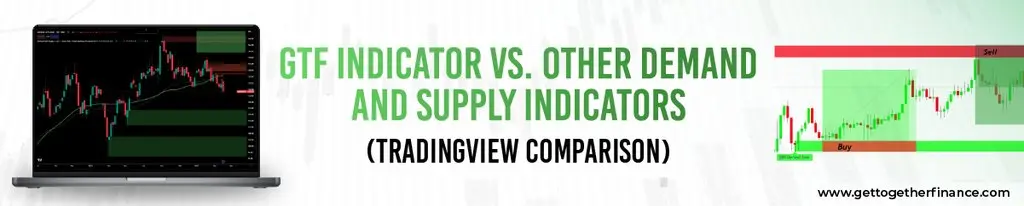
There are several demand and supply indicators on TradingView, but they all have different features. Some only mark zones, while others require separate indicators for volume analysis, trend, or moving averages. GTF Indicator 2.0 combines key tools in one place for easier chart analysis. The table below compares the GTF Indicator with common TradingView demand and supply indicators.
| Features | GTF Indicator 2.0 | TradingView Demand and Supply Indicators |
| Demand & Supply Zone Detection | GTF Indicator 2.0 automatically marks demand and supply zones | Many TradingView indicators can mark demand and supply zones, but their features are different |
| Multiple timeframe EMAs | It shows multiple timeframe EMAs on a single chart | This feature depends on the individual indicator |
| Chart Setup | The GTF Indicator 2.0 combines demand and supply zone marking with its built-in EMA features | Some TradingView demand and supply indicators require other tools to add other indicators separately |
| Zone-Marking Modes | It offers Aggressive, Conservative, and Dynamic modes for zone marking | The available modes and settings depend on the individual indicator |
| Best For | The GTF Indicator 2.0 is best for beginners, part-time, and experienced traders | It depends on the features and settings of the individual indicator |
The above table compares the main features of the GTF Indicator 2.0 with other demand and supply indicators available on TradingView. Along with these features, understanding fresh zones and multiple timeframes can help you evaluate demand and supply zones more effectively.
Fresh Zones vs. Tested Zones: Why It Matters
Not every demand and supply zone works the same way. A zone is considered fresh if price hasn’t returned to it after forming. A lot of traders think fresh zones tend to work better because buyer or seller activity is still present.
A zone is considered tested once price has returned to it. Each time price revisits the same zone, it tends to lose strength. This means a zone that’s been tested many times is less likely to cause a big price reaction compared to a fresh zone.
By understanding the difference between fresh and tested zones, you can find better opportunities and make smarter decisions.
Multi-Timeframe Zone Confluence
If you look at more than one timeframe, it can improve your trading decisions. For example, spotting a demand zone on a higher timeframe and refining entry on a lower timeframe is called multi-timeframe confluence.
GTF Indicator 2.0 also shows multiple timeframe EMAs on a single chart. This helps traders compare market information across timeframes without switching between charts.
How to Trade Using the GTF Indicator 2.0: 4 Step Workflow

When you learn how to use the best demand and supply indicator correctly, you can make better trading decisions. By following the right steps, the GTF Indicator 2.0 helps you find demand and supply zones, confirm the trend, and plan your trades. In order to use the indicator more effectively, follow the simple steps below:
Step 1: Identify the Dominant Zone (Demand or Supply)
First, check whether the price is near a demand or supply zone. A demand zone can signal a good buying opportunity, while a supply zone can signal a good selling opportunity. These zones are automatically marked by the GTF Indicator 2.0, so you can find them more easily.
Step 2: Check the Trend and EMA Information
Once you’ve spotted the demand or supply zone, check the trend and moving-average details before planning your trade. GTF Indicator 2.0 provides multiple timeframe EMAs on a single chart, which can help you compare price information across different timeframes.
Step 3: Wait for Price to Retest the Zone
It is important to avoid entering right after a zone forms. You need to always wait for the price to return to the zone first. When price reacts from the zone, it can provide a better entry point.
Step 4: Set Entry, Stop Loss, and Target Using the Zone Boundaries
Once price reacts from the demand or supply zone, you can plan your trade. Now, enter your trade close to the zone; keep your stop loss right outside it and aim your profit target at the next zone. This helps you manage risk while trading with more confidence.
Recommended GTF Indicator Settings by Trading Style
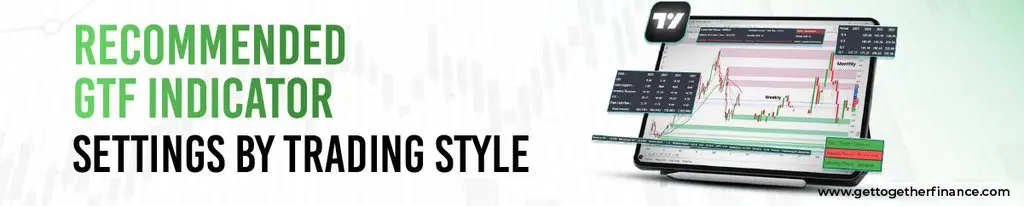
Every trader sets the GTF Indicator’s settings based on their trading style. Here are some general recommendations that you can use to make the GTF Indicator work more effectively.
| Trading Style | Recommended Moving Average | Timeframe | Zone Sensitivity |
| Intraday Trading | EMA20 + SMA50 | 5–15 Minutes | Dynamic |
| Swing Trading | SMA50 + DMA200 | 1 Hour–Daily | Conservative |
| Positional Trading | DMA200 | Daily–Weekly | Conservative |
Real Benefits: How the GTF Indicator Helps Traders Save Time & Reduce Errors

Using the GTF Indicator is like having a personal trading assistant, as it helps with:
- Minimizes Emotional Trading: With clear, rule-based insights, it keeps emotions in check. So no more FOMO trading.
- Saves Time: Its automation allows users to focus more on executing trades than just reading the charts.
- Improves Accuracy: By focusing on only the most critical zones, it minimises the chances of making costly errors for traders.
- Supports Scalping and Swing Trading: With its real-time data and precision, it works beautifully for short- and medium-term strategies.
How to Access the GTF Indicator: Pricing & Free Access Options

It is quite simple to get started with the GTF Demand and Supply Indicator. Let’s take a look at the process once:
Lifetime Free Access with “Trading in The Zone – Advanced Course“: If you enroll in “Trading in The Zone – Advanced Course”, you will get free lifetime access to the indicator along with an in-depth understanding of demand and supply dynamics. So no buying the tool separately. This course also includes one year of access to the recorded course.
Buy the Indicator Separately: If you only need the indicator, you can purchase it for just ₹5000 per year. Visit the GTF website for hassle-free purchasing and start your trading journey today.
Users have rated ‘GTF Indicator’ as one of the most accurate demand and supply indicators in the stock market.
Final Thoughts: Is the GTF Indicator Worth It?
The GTF Indicator isn’t more than just a simple indicator but an essential trading companion for traders who value precision, efficiency, and results. By automating the identification of demand and supply zones, the tool can alleviate the need for manual analysis so traders can focus on what really matters: executing winning trades.
GTF indicator is rated as the best demand and supply indicator in the stock market by its users and is a must-have. So it’s time to stop relying on guesswork, especially when you can trade with clarity and confidence.
FAQs
Q. Is the GTF Indicator available on TradingView?
Yes. The GTF Indicator is available on TradingView. After GTF grants you access, you can add it from the “Invite-only scripts” section. A TradingView Premium plan is only required if you want to use the indicator on lower timeframes.
How does the GTF Indicator work?
It focuses on identifying areas of high demand and low supply (demand zones) and areas of low demand and high supply (supply zones) on the price chart. But its key features go beyond just detecting zones. It also shows current trends, crossovers, real-time volume, EMAs, and more.
How much does the GTF indicator cost?
Although it’s free for life for GTF students enrolled in “TIZ-Technical Analysis” or “GTF Options”, if you’re not a student, you can still buy the indicator for just rupees RS 5000.
Does the GTF Indicator guarantee profits?
No Indicator in the stock market guarantees profits. However, with the help of the GTF indicator, you can easily plan your strategy and find trading opportunities without a miss.
Can I use the GTF Indicator with other technical indicators?
Yes! Albeit GTF Indicator is a one-stop solution for zone detection, trend identification, crossovers, and real-time volume info, you can combine it with any other technical indicators of your choice to enhance trading decisions.
Is the GTF Indicator good for beginners?
Yes, the GTF Indicator is good for beginners because it automatically marks demand and supply zones and simplifies chart analysis.
Can I use the GTF Indicator for intraday trading?
Yes, you can use the GTF Indicator for intraday trading as well as swing and positional trading.



