
Breakout Trading Strategies: Complete Guide to Spotting & Profiting from Breakouts
- Updated on : August 24, 2026
- 4354 Views
- by Arun Singh Tanwar

 Facebook
 Instagram
 Youtube
 Linkedin

People are attracted to the Indian stock market because of its potential to give financial growth & robust economic growth. Though long-term investments are more preferred by people, many of them get excited by the concept of trading also. A lot of people in India prefer trading in the stock market and booking profits in quick market movements.
There are several types of trading that are practiced in the stock market, but all of them require detailed or advanced technical knowledge. These studies about trading guide the trader about the correct entry & exit points in the trade at the right time. The most used strategies in technical analysis are breakout trading strategies. It helps traders to predict the movement of the stock with the help of different patterns.
What Is Breakout Trading? Definition & How It Works

Breakout trading is a strategy where traders enter a position the moment a stock price moves clearly beyond a support or resistance level. The goal is to catch the momentum of the new trend as it begins.
Instead of guessing where the price will go next, breakout traders simply react to what the price is already doing. They wait for the stock to break out of a tight range, a chart pattern, or a key price zone, and then they enter the trade.
Here is how it looks in practice. A stock trades between Rs 130 as support and Rs 160 as resistance for several days. Buyers and sellers are in a standoff and the price keeps bouncing inside this range. The moment the price closes clearly above Rs 160, breakout traders take this as a sign that buyers are now in control. They enter the trade expecting the price to keep rising. The same idea works in reverse when the price breaks below support.
This is why breakout trading is one of the most popular strategies in technical analysis. It does not ask you to predict the future. It simply asks you to notice when the market has already made its move.
Why Use Breakout Trading Strategies? Key Benefits for Traders

So why do so many traders, both new and experienced, keep using breakout strategies? Here are the main reasons.
- Realistic, well-defined targets: Because breakouts are measured against clear support/resistance levels or chart patterns, traders can set practical profit targets before even entering the trade.
- Faster returns: Breakouts often trigger sharp, short-term price moves, which means profits (or losses) tend to materialise quickly rather than requiring weeks of waiting.
- Built-in risk definition: The same support/resistance levels that signal an entry also double up as natural stop-loss zones, helping traders cap their downside from the start.
- Ride the trend early: Breakout trading lets you catch a new trend right as it forms, rather than waiting for confirmation days later, by which point much of the move may already be over.
- Endless opportunities: Markets are constantly forming and breaking patterns, so there’s a steady stream of fresh setups for traders who build their skills around this strategy.
9 Types of Breakout Chart Patterns (With Entry & Exit Rules)
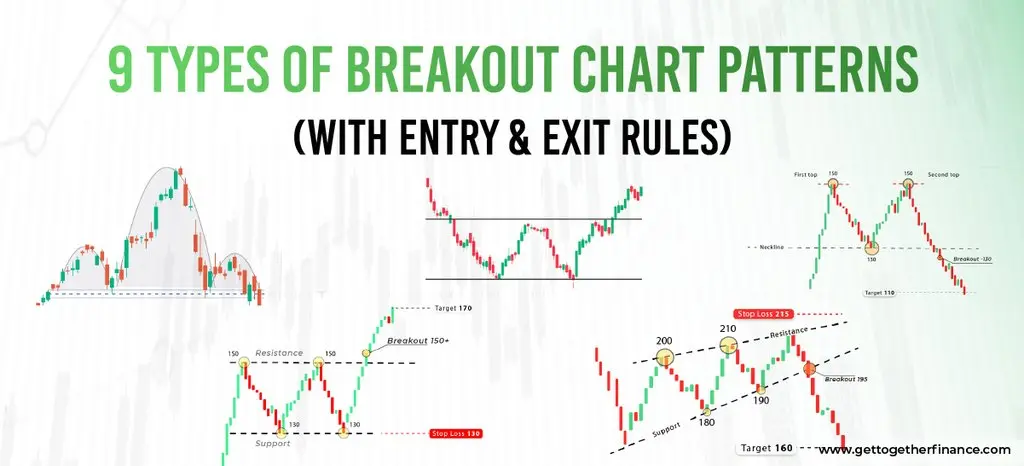
Breakout patterns are shapes that form on a candlestick chart over time. Each shape tells traders something about the fight between buyers and sellers, and each one comes with its own rules for entry, stop loss, and target. Below are the most common breakout patterns every trader should know, along with how to trade each one.
1. Head and Shoulders Breakout: How to Trade It and Set Targets
This pattern forms with three peaks. The middle peak is the highest and is called the head. The two outer peaks are roughly equal in height and are called the shoulders. A line connecting the lows between these peaks is called the neckline.
To trade this pattern, traders wait for the price to close clearly below the neckline. This is the entry point for a short trade. The stop loss is placed just above the right shoulder, since a move back above this level would suggest the pattern has failed.
To set the target, measure the distance from the top of the head down to the neckline. This same distance is then projected downward from the breakout point to get an estimated target for the move.
2. Double Bottom Breakout Strategy: Entry, Stop Loss and Target
This pattern looks like the letter W. It forms when the price hits a low, bounces up, comes back down to a similar low again, and then bounces up a second time. The high point between the two lows acts as resistance and is sometimes called the neckline.
A useful confirmation to look for is volume on the second bottom. If volume is higher on the second low compared to the first, it adds more weight to the pattern.
The entry comes when the price breaks above the neckline. The stop loss is placed just below the second bottom. Many traders aim for a risk to reward ratio of about 1 to 2, meaning the target is roughly double the distance of the stop loss from the entry point.
3. Double Top Breakout Strategy: How to Short a Bearish Reversal
This pattern looks like the letter M and is the opposite of the double bottom. It signals a bearish reversal, meaning the price is likely to fall after this pattern completes.
It forms when the price reaches a high, pulls back, rises again to a similar high, and then falls. The low point between the two highs acts as support and works as the neckline for this pattern.
The short entry comes when the price breaks below this neckline. The stop loss is placed just above the second top. One helpful sign to watch for is volume divergence, where the second top forms on lower volume than the first. This often hints that buying pressure is fading.
4. Rectangle (Range) Breakout: Trading Consolidation Zone Breaks
A rectangle pattern, also known as a range, forms when the price moves sideways between a clear support level and a clear resistance level for a period of time. The price keeps bouncing between these two levels without making real progress in either direction.
A breakout can happen from either side of the rectangle, and both directions are valid setups. If the price breaks above resistance, traders look for a long entry. If it breaks below support, traders look for a short entry.
To set the target, measure the height of the rectangle, meaning the distance between support and resistance. This height is then projected from the breakout point in the direction of the breakout. The stop loss is placed on the opposite side of the range from the breakout.
5. Rising Wedge Breakout: Spotting Bearish Reversals and Short Setups
The name of this pattern can be confusing. Even though it is called a rising wedge and the price is moving upward while it forms, this pattern usually leads to a bearish move. Many beginners mistake it for a bullish continuation pattern, which is not correct.
A rising wedge forms with two upward-sloping lines that move closer together over time. As the pattern forms, volume tends to shrink, which is a sign that the upward move is losing strength.
The short entry comes when the price breaks clearly below the lower support line of the wedge. The stop loss is placed above the most recent swing high. The target is set by measuring the height of the wedge at its widest point and projecting that distance downward from the breakout point.
6. Falling Wedge Breakout: Bullish Reversal Setup and Trade Plan
The falling wedge works the opposite way to the rising wedge. While the price moves downward during its formation, this pattern usually leads to a bullish reversal.
It forms with two downward-sloping lines that move closer together over time. The long entry comes when the price breaks above the upper trendline of the wedge. This breakout is often accompanied by an increase in volume, which adds confidence to the move.
The stop loss is placed below the most recent swing low. The target is set by measuring the height of the wedge at its widest point and projecting that distance upward from the breakout point.
7. Triangle Breakout Patterns: Ascending, Descending and Symmetrical
Triangle patterns come in three forms, and each one has its own bias.
An ascending triangle has a flat resistance line on top and a rising support line on the bottom. This shape usually carries a bullish bias, and the breakout most often happens to the upside.
A descending triangle has a flat support line on the bottom and a falling resistance line on top. This shape usually carries a bearish bias, and the breakout most often happens to the downside.
A symmetrical triangle has both lines converging toward each other, with no strong bias in either direction. Here, the breakout direction itself becomes the signal for the trade.
For all three types, traders look for a confirmation checklist before entering. This includes a candle closing clearly beyond the trendline, rather than just touching it, along with a rise in volume on the breakout. Some traders also wait for a retest of the broken line before entering, to reduce the chance of a false move.
8. Flag and Pennant Breakout: How to Trade Continuation Patterns
Flags and pennants are short-term patterns that usually appear in the middle of a strong trend, which is why they are called continuation patterns.The pattern starts with a sharp move in price, called the flagpole. After this sharp move, the price consolidates for a short while, forming either a flag shape or a small triangle shape, which is the pennant. During this consolidation, volume usually drops, showing that the market is taking a pause. When the price breaks out of the flag or pennant in the same direction as the flagpole, volume usually surges again, confirming the move.
9. Cup and Handle Breakout: Identifying and Trading This Pattern
This pattern gets its name because it looks like a cup with a handle on the chart. The cup forms with the price moving down and then curving back up in a U shape. After the cup is complete, the price dips slightly again in a smaller move, forming the handle.The entry comes when the price breaks above the resistance level formed by the top of the handle. The stop loss is placed below the low point of the handle.
To set the target, measure the depth of the cup, from its highest point to its lowest point. This depth is then projected upward from the breakout point to estimate how far the move could go.
Best Technical Indicators for Breakout Trading (MACD, RSI, Bollinger Bands & More)

Chart patterns tell you a story, but indicators help confirm whether that story is likely to come true. Using the right indicators alongside a breakout pattern can help traders avoid jumping into a move too early or too late. Here are the indicators that matter most when trading breakouts.
MACD for Breakout Confirmation: Settings and Signals Explained
MACD stands for Moving Average Convergence Divergence. It is made up of two lines, called the MACD line and the signal line, along with a histogram that shows the gap between them.
For breakout confirmation, traders watch for a MACD crossover that happens around the same time as a price breakout. If the price breaks above resistance and the MACD line crosses above the signal line at the same time, this adds confidence that buyers are in control.
The most commonly used settings for MACD are 12, 26, and 9. Many traders keep these default settings as they work well across different time frames for spotting breakout confirmation.
RSI Breakout Strategy: Using Relative Strength Index to Filter Signals
RSI, or Relative Strength Index, measures how fast and how far the price has moved recently, on a scale of 0 to 100.
When RSI moves above 60, it often signals strong upward momentum, which can support a bullish breakout. On the other hand, if the price breaks out but RSI shows divergence, meaning the price makes a higher high while RSI makes a lower high, this can be an early warning sign of a false breakout.
It is also worth noting that RSI thresholds can behave a little differently in Indian markets depending on whether you are looking at equity charts or futures charts, so traders should observe how RSI behaves on the specific instrument they are trading before relying on fixed levels.
Bollinger Bands Breakout: How Band Squeezes Signal Big Moves
Bollinger Bands are made up of three lines: a middle line, which is usually a moving average, and an upper and lower band that expand and contract based on volatility.
One of the most useful concepts here is the band squeeze. This happens when the bands move very close together, showing low volatility, also known as low bandwidth. A squeeze often comes right before a big move in price.
The breakout entry signal comes when the price closes outside one of the bands after a squeeze. A close above the upper band can signal a bullish breakout, while a close below the lower band can signal a bearish breakout.
EMA Breakout Strategy: Using Moving Averages to Confirm Trends
EMA, or Exponential Moving Average, gives more weight to recent prices, which makes it react faster to price changes compared to a simple moving average.
Traders often use the 20, 50, and 200 EMA together to understand the bigger trend. When a shorter EMA, like the 20 EMA, crosses above a longer EMA, like the 50 EMA, it can confirm that a breakout has real strength behind it.
These EMAs also work as dynamic support and resistance levels. During an uptrend, the price often pulls back to the 20 or 50 EMA before continuing higher. Watching how price reacts around these levels can help traders confirm whether a breakout is likely to hold.
Breakout vs Breakdown Trading: Key Differences and When to Use Each
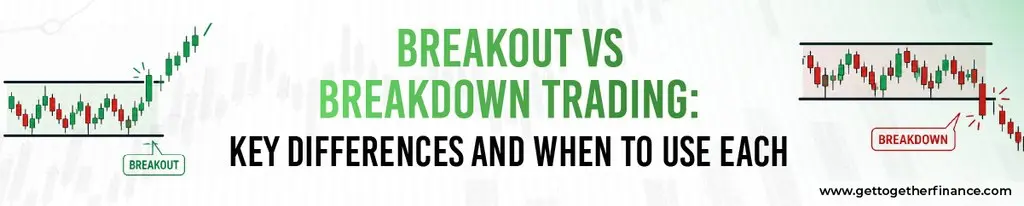
Breakout and breakdown are simply two sides of the same idea, but it helps to understand how they differ in practice.
| Aspect | Breakout Trading | Breakdown Trading |
| Direction | Price moves above resistance | Price moves below support |
| Trade taken | Long, or buy, position | Short, or sell, position |
| Market view | Bullish, expecting prices to rise | Bearish, expecting prices to fall |
| Confirmation needed | Strong volume on the up move, close above resistance | Strong volume on the down move, close below support |
| Risk management | Stop loss placed below the broken resistance | Stop loss placed above the broken support |
| When to use | When the overall trend or higher time frame is bullish | When the overall trend or higher time frame is bearish |
Both approaches use the same core principles. The main difference is direction and the type of position you take. A trader who understands both can look for opportunities on either side of the market, depending on which way the trend is pointing.
Demand and Supply Zones: The GTF Approach to More Reliable Breakouts

While most traders rely only on chart patterns like triangles, flags, and wedges, there is another approach that can make breakout trading more reliable, and that is using demand and supply zones.
A demand zone is an area on the chart where buyers have stepped in strongly in the past, causing the price to move up sharply from that area. A supply zone works the other way, an area where sellers have stepped in strongly, causing the price to fall sharply.
The advantage of using these zones is that they often show you where a breakout is more likely to succeed or fail, even before the breakout happens. For example, if a breakout above resistance is happening close to a strong supply zone, the move may struggle to continue. But if there is no nearby supply zone in the way, the same breakout has a much higher chance of running further.
This is different from relying only on chart patterns, since chart patterns show you the shape of price movement, but demand and supply zones show you why the price is likely to react the way it does at certain levels.
If you want to learn how to identify and use demand and supply zones in more depth, including how to combine them with chart patterns and indicators for higher accuracy, our Advanced Technical Analysis Course covers this approach in detail.
Final Thoughts
From the above discussion, it can be concluded that breakout trading strategies’ patterns are formed in different shapes on a candlestick chart. Traders need advanced knowledge about technical analysis to spot these patterns along with their break-out points. It helps a trader in making the entry into the trade at the right time. Following this, breakout trading strategies require in-depth knowledge about price action, and traders need to possess core skills like attention to get the details while analyzing charts.
Trading with the help of breakout trading strategies can help in booking exciting profits if done with excellent guidance and proper knowledge. Also, one needs to learn these strategies and chart analysis first and then step into trading. Though trading is risky, doing it right with expert guidance can help you generate higher gains.
FAQ
1. What are breakout trading strategies?
Breakout trading tactics entail entering a trade when the price moves above or below a predetermined level of support or resistance. Traders hope to profit from substantial price moves following the breakout.
2. How do breakout trading strategies work?
Breakout trading involves finding important levels of support and resistance. When the price breaks out of these levels, traders enter positions, expecting the price to continue in the same direction as the breakout.
3. What indicators are commonly used in breakout trading?
Moving averages, Bollinger bands, MACD, and RSI are all common indicators. These indicators assist traders in identifying potential breakout levels and evaluating the strength of the breakout.
4. How do you identify breakout opportunities?
Breakout possibilities are recognized by tracking price movements near support or resistance levels. Breakouts happen when the price convincingly exceeds certain levels, indicating a possible trend continuation.
5. What are the advantages of breakout trading?
Breakout trading provides the opportunity to capture substantial price moves in trending markets. It enables traders to enter deals early in a new trend, potentially yielding bigger profits.
6. What are the risks associated with breakout trading?
False breakouts occur when the market briefly climbs over a support or resistance level before retreating. Furthermore, breakouts can cause significant price fluctuations, raising the chance of loss if trades are not managed correctly.
7. Can breakout trading be applied to any market?
Yes, breakout trading is applicable to a variety of markets, including stocks, currency, commodities, and cryptocurrencies. When employing breakout tactics, traders should take into account market conditions and liquidity levels.
8. What are some common entry and exit techniques in breakout trading?
Common entry tactics include entering trades when the price breaks above or below a specified threshold and receives confirmation. Exit strategies used by traders include trailing stops and profit targets.
9. How do news events impact breakout trading strategies?
News events can cause major price changes, resulting in the breakout or breakdown of important support or resistance levels. Traders should monitor impending news events and alter their breakout tactics accordingly.
10. Are there any specific patterns to look for in breakout trading?
Triangles, rectangles, and flags are among the most common breakout patterns. These patterns arise during consolidation periods before a breakout, giving traders viable entry points when the price breaks out of the pattern.



