Horizontal Channel: What It Means, How It Works, and Example
- Updated on : October 13, 2025
- 640 Views
- by Manaswi Agarwal

 Instagram
In the world stock market filled with intricacies, traders are constantly looking for profitable opportunities. Technical patterns and indicators are a form of identification of those profitable opportunities in the market wherein horizontal channel is a key concept that provides valuable insights with potential trading opportunities in the market. Give a thorough visit to this blog and understand how the horizontal channel works for traders.
What is the Horizontal Channel?

In technical analysis, the horizontal channel connects the variable pivot highs and lows forming a trend line that highlights price movements during a trading session. Generally, it depicts the sideways trend as the price moves in a horizontal range. Typically, it defines a consolidation phase where the prices resist moving beyond a certain level. Traders identify well defined support and resistance levels acting as a lower and upper boundary.
How to find a Horizontal Channel Chart Pattern?

Technical indicators like Fibonacci Retracement, moving averages and trend lines are significantly used to smoothen the process of identifying horizontal chart patterns. Here are some characteristics that you need to look for when searching for horizontal pattern in the chart:
Identify Rectangular Pattern
The horizontal channel forms the sideways trend that looks similar to a rectangle representing an equal number of buyers and sellers that connects four contact points with at least two lows and two highs.
Top Trend Line and Bottom Trend Line
The top trend line represents the resistance level while the bottom trend line is the support level. To consider formation of a horizontal chart as a valid pattern, the price must touch the resistance level as well as the support level at least three times.
Consolidation Phase
The price is observed to hang between the two trend line where the buyers become active at the support level and the sellers grab their hand at the resistance level. The price consolidates for a longer period and hence gets ready for its breakout.
Breakout
After a long consolidation phase, at the fourth contact point, the price gives a breakout. If the price breaks resistance level, the security gives a bullish move while in other cases when the breakout is given below the support level, a bearish move is observed.
Entry: Enter the long position after a candle closes above the resistance. Wait for a strong breakout above the channel with increased volume. On the other hand, enter the short position after a candle closes below the support.
Exit: Exit your position near support or resistance levels according to the nature of your trading position.
Advantages of Horizontal Channel

Trading in the financial market requires solid strategies to sustain market volatility which can employ maximum profits for traders.
Predicting Breakouts
Traders can take advantage of horizontal channels to identify potential breakouts in the prices as it occurs when the consolidation phase ends. With the help of key support and resistance levels, traders can enter the position in the direction of breakout.
Trend Reversal
Horizontal channel is an advanced concept which helps in identifying potential trend reversals, traders look for bearish signals and plan to take the entry when the price breaks the support level.
Multiple Time Frames
The horizontal chart pattern is clearly visible on multiple time frames. Horizontal channel is formed on all time units from intraday to daily, weekly or monthly charts.
Support and Resistance Level in Horizontal Channel
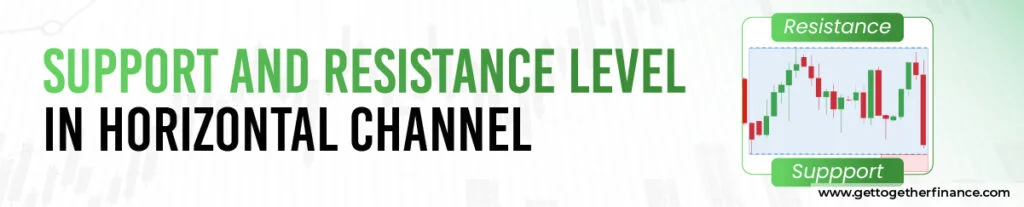
The trend lines in the horizontal channel are parallel where the top trend line represents the resistance level and the bottom line represents the support level. These levels are closely monitored by an investor to make their position. The formation of horizontal channels with parallel lines lets investors quickly find the entry and exit points.
The use of support level and resistance level is to clearly determine the entry and exit as well to provide a clear and systematic guide for trading.
During the consolidation phase when the price reaches the top trend line or the resistance level, traders sell their positions or short them with the intention of downward movement in the prices. When the price roams around the two trend lines within the channel, the traders hold their trade. A long position is entered when the price reaches the support level.
Also Read : Understanding Support and Resistance Basics
Limitations of Horizontal Channel Chart Pattern

Traders do not have proper guidance about the next price movement in security with the horizontal channel chart pattern which requires them to carefully execute their trades.
Risk Management
Trading on a horizontal chart pattern is nowhere associated with managing your risks as it does not consider stop loss or targets. It becomes difficult for traders to make decisions based on quantity and hence is not aware about their exit points when the prices do not move in a favorable direction. This restricts them to manage their risks efficiently.
Technical Support
The price movement of horizontal channels is highly dependent on other technical factors like moving averages, volume indicators, etc. Instead of this, using a demand and supply approach is more reliable for better results as it includes top down approach and all other important technical factors.
Some interesting things around horizontal channel:
- The longer the horizontal channel or the consolidation, the stronger the exit movement will be.
- Traders have observed a price pullback on the channel after exit plotting an entry point for traders.
- The breakout occurs mostly at the fourth touch at one of the trend lines of the horizontal channel.
Also Read : stock market chart patterns
Wrap It Up…
From the blog, we can deeply know about the working of horizontal channels on the chart pattern and its ability to make traders profitable. Apart from this, we can realize that demand and supply theory is a better technical approach to achieve reliability and accuracy. GTF – Trading in the Zone is an advanced technical analysis course that considers demand and supply approach with top down approach, sector support, moving averages, and other technical indicators.
FAQs
What is a Horizontal Channel Pattern?
The horizontal channel is the chart pattern which represents the consolidation phase of the security. It signifies a sideways trend with the two trend lines that connect pivot highs and lows highlighting the price movements during a trading period.
How to trade horizontal channel chart patterns?
To trade horizontal channel chart patterns, a trader must place their entry at the breakout levels. The trade must be supported by other technical factors like volume confirmation, EMA support, etc.
What to consider when trading horizontal chart patterns?
Several considerations like volume indicator, support of demand and supply zones, top down approach, multiple time frame analysis, etc with correct technical approach must be considered carefully.
How can I avoid false breakouts?
Wait for the breakout candle to close outside the channel and then confirm the breakout with increased volume.
How long do Horizontal Channels typically last?
Horizontal channels can last from a few hours to several months, depending on the market conditions.


