
How to Identify and Trade Support and Resistance Zones: Demand & Supply Framework for Indian Traders
- Updated on :
- 1265 Views
- by Arun Singh Tanwar

 Facebook
 Instagram
 Youtube
 Linkedin
With the Indian economy being called the “Bright Spot” in the world by the IMF President, the focus on the Indian stock markets is growing. So is the number of investors and traders who aim to build a fortune by investing in India.
Today, it is important for you as a trader to understand the basics of how the stock markets function and be updated about the developments around the world. One such concept is support and resistance. The market price of a stock is determined by the forces of demand and supply. Buyers and sellers create their orders at different prices, which are called Bid and Ask prices, respectively.
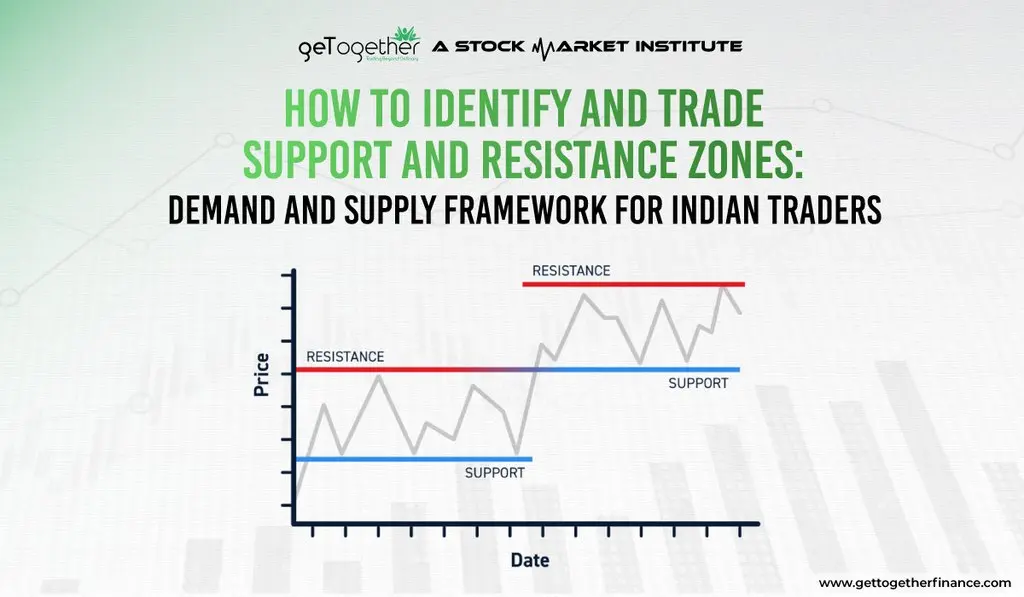
At some price levels, buyers and sellers form clusters due to multiple and high-volume orders, resulting in demand or supply concentration. These are called support and resistance levels. Simply put, they provide a range between which the market price of a stock usually moves.
However, support and resistance are better understood as zones rather than exact prices. A stock may react around an area instead of reversing at one precise price. Understanding this difference can help traders identify stronger trading opportunities and avoid entering a trade simply because the price touched a particular level.
This blog details the concept of support and resistance trading and explains how to identify and trade support and resistance zones using demand and supply, price action, confluence, and proper risk management.
The Foundation: Support and Resistance as Zones, Not Lines
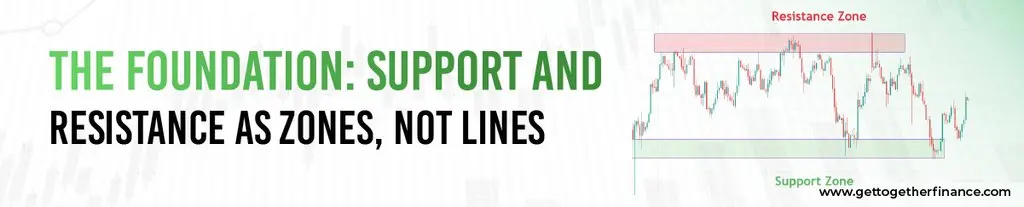
One of the most important ideas in support and resistance levels trading is that the market does not always respect an exact price. Instead, buyers and sellers can become active across a price range. This is why traders should think in terms of support and resistance zones.
What Are Support and Resistance Zones?
A support zone is an area where buying interest may increase and prevent the price from falling further. Similarly, a resistance zone is an area where selling interest may increase and prevent the price from moving higher.
For example, instead of assuming that ₹1,000 is the only support price for a stock, a trader may observe the stock reacting several times between ₹990 and ₹1,020. This entire area can be treated as a support zone.
Thinking in zones also helps account for normal market noise, volatility, stop hunts, and differences in the prices at which market participants enter or exit their positions.
The strength of a zone can be assessed by looking at how the price has reacted to it previously. Multiple meaningful reactions, strong price movement away from the zone, and supporting demand or supply can make the zone more relevant.
How Zones Form Through the Demand & Supply Lens
Support and resistance zones are closely connected to demand and supply. When demand is stronger than supply around an area, buyers can push the price higher. When supply becomes stronger than demand, sellers can push the price lower.
This means that instead of simply asking, “Where is the support line?” a trader can ask, “Where are buyers currently positioned?” Similarly, at resistance, the focus shifts toward identifying where sellers are active.
This demand and supply perspective provides a stronger foundation for identifying zones and understanding why price reacts around them.
What Are Support and Resistance Zones?
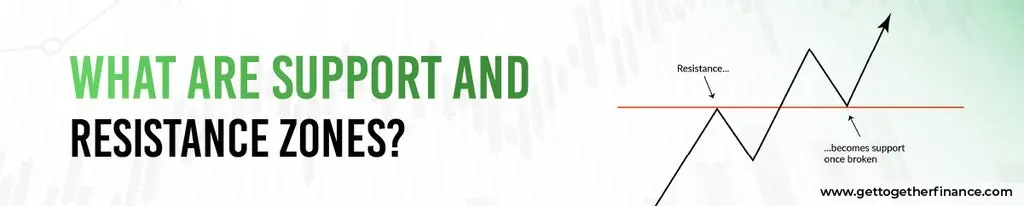
A support zone is a price area where strong buying interest outweighs selling pressure, preventing a stock from falling. For example, if a ₹1,000 stock repeatedly stops dropping between ₹980 and ₹1,000 because buyers step in, that area acts as a support zone.
Similarly, a resistance zone is a price range where selling pressure may prevent the price from rising. When sellers consistently step in between ₹1,000 and ₹1,020, that price range creates a resistance zone.
It is crucial to understand support and resistance zones because they help traders avoid false signals and make trading decisions with greater confidence. Rather than depending on one price level, traders use price action and volume to confirm support and resistance zones.
How Zones Form (Demand & Supply Lens)
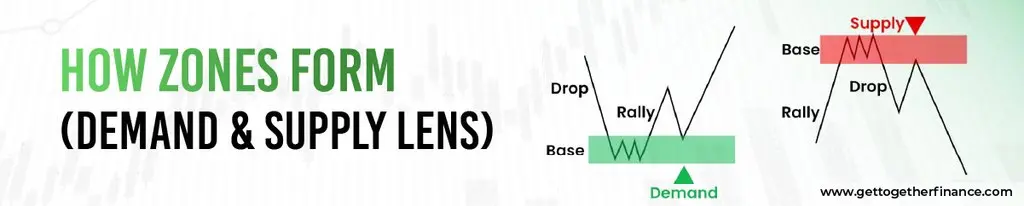
Support and resistance zones form whenever supply and demand shift in the market. When buyers are stronger than sellers, a stock may find support, while when sellers are stronger than buyers, the price may face resistance.
A support or resistance zone becomes stronger when the price reacts to the same area two or three times. But traders shouldn’t just count the touches. They also need to look at price action, volume, and how strong each reaction was.
This demand-and-supply approach reveals why buyers or sellers repeatedly show up at certain levels, which makes support and resistance zones easier to spot.
Advanced: Confluence Zones for High-Probability Trading
Identifying a support or resistance zone is only the first step. Traders can improve their analysis by looking for confluence, where multiple independent factors point toward the same area.
What Is a Confluence Zone?
A confluence zone is an area where two or more technical factors support the same trading view. For example, a support zone may overlap with a moving average, a trendline, a volume-based area, and a psychological price level.
When several factors come together, the zone can become more significant than a zone supported by only one method. However, confluence does not guarantee that a trade will work. It simply provides additional evidence for the trading decision.
Building Your Confluence Model
A simple confluence model can include:
- Static support or resistance zone
- Higher timeframe trend
- Moving average
- Volume
- Trendline
- Psychological round numbers
- Price action confirmation
For example, a support zone that also aligns with a higher timeframe trend, a moving average, and increased volume may provide stronger evidence than a single support level on its own.
You can think of confluence as a way of organizing your analysis rather than adding more and more indicators to the chart. The goal is to find a few meaningful factors that agree with each other.
Using GTF Indicator 2.0 for Zone Identification
Manual identification of multiple confluence factors can take considerable time. GTF Indicator 2.0 can help traders streamline their chart analysis by highlighting relevant zones and combining technical information that may otherwise require manual observation.
The purpose is not to replace analysis, but to help traders identify potential zones more efficiently and then confirm them through price action, market context, and risk management.
Traditional Methods to Identify Support and Resistance Zones

Before understanding support and resistance zones through the demand and supply framework, it is important to understand the traditional methods traders use to identify them.
Multiple factors need to be analyzed carefully before determining a support or resistance level. If you pick the wrong clue, it can cause your capital to erode. Here’s how you can determine the support and resistance levels:
- Historical Price Points: Looking back is always an important step. By studying the stock’s historical price, you can recognize patterns and levels from which the price rebounded or retraced.
- Draw Trendlines: When the market is in a downtrend, you can draw a line by connecting the lows created by the stock price. This is called the trendline. It shows the various levels at which the stock price can rebound. Similarly, connecting previous highs can help identify potential resistance areas.
- Moving Averages: Usually, the 50 or 200-day moving averages are used as a benchmark to determine the support and resistance levels. In an uptrend, if the price line cuts the MA line from below, the price goes further up. Hence, it can act as a support level. In a downtrend, moving averages can also act as dynamic resistance.
- Volume Analysis: When the price is close to a potential support or resistance area and the volumes rise, it generally shows increased participation. The combination of price movement and volume can therefore provide additional confirmation instead of relying on the level alone.
Advanced: Confluence Zones for High-Probability Trading
Identifying a support or resistance zone is only the first step. Traders can improve their analysis by looking for confluence, where multiple independent factors point toward the same area.
What Is a Confluence Zone?
A confluence zone is an area where two or more technical factors support the same trading view. For example, a support zone may overlap with a moving average, a trendline, a volume-based area, and a psychological price level.
When several factors come together, the zone can become more significant than a zone supported by only one method. However, confluence does not guarantee that a trade will work. It simply provides additional evidence for the trading decision.
Building Your Confluence Model
A simple confluence model can include:
- Static support or resistance zone
- Higher timeframe trend
- Moving average
- Volume
- Trendline
- Psychological round numbers
- Price action confirmation
For example, a support zone that also aligns with a higher timeframe trend, a moving average, and increased volume may provide stronger evidence than a single support level on its own.
You can think of confluence as a way of organizing your analysis rather than adding more and more indicators to the chart. The goal is to find a few meaningful factors that agree with each other.
Using GTF Indicator 2.0 for Zone Identification
Manual identification of multiple confluence factors can take considerable time. GTF Indicator 2.0 can help traders streamline their chart analysis by highlighting relevant zones and combining technical information that may otherwise require manual observation.
The purpose is not to replace analysis, but to help traders identify potential zones more efficiently and then confirm them through price action, market context, and risk management.
How to Trade Support & Resistance Zones?
Now that you have understood the support and resistance basics, you need to learn how to trade when the price is near the support or resistance zones.
If you jump to trade without a proper strategy, it can harm your capital. Here’s how you can use the support and resistance strategy to maximize your profits:
- Use Confirmations: Price movements in the stock markets are unpredictable. Hence, it is important to cross-check your analysis. If the following signals accompany the support and resistance zones, you should consider them as confirmation:
- Formation of Candlestick patterns
- Spikes in the Volume
- Moving Averages
- Momentum Indicators
- Market Factors
The Buy Signal at Support with Price Action Confirmation
A trader should not automatically buy a stock simply because it reaches a support zone. The price first needs to show signs that buyers are responding to the area.
Price action confirmation can include a rejection from the zone, a pin bar, a bullish reversal pattern, or a strong move away from the support area. Waiting for confirmation can help reduce the risk of entering too early.
The basic idea is to identify the support zone first, observe how price behaves inside or around it, and then look for confirmation before entering the trade.
The Sell Signal at Resistance with Price Action Confirmation
The same principle applies to resistance. Instead of selling simply because the price reaches a resistance zone, traders can wait for evidence that sellers are becoming active.
A bearish rejection, pin bar, fakey, or other bearish price action near the resistance zone can provide additional confirmation. The trade should then be planned with a clear entry, stop loss, and exit level.
Stop Loss & Position Sizing
Stop loss is an important part of support and resistance trading because a zone can fail. A stop loss should be placed at a level that invalidates the trading idea rather than at an arbitrary price.
For example, if a trader enters near a support zone, the stop loss may be placed below the zone with an appropriate buffer. Similarly, for a resistance trade, the stop loss may be placed above the resistance zone.
Position size should also be adjusted according to the amount of risk and the distance between the entry and stop loss. A wider stop does not automatically mean taking a larger position. Instead, position size should reduce when the stop distance increases so that the planned risk remains controlled.
Multiple Timeframe Confirmation
Support and resistance zones can look different across timeframes. This is why multiple timeframe confirmation can be useful.
A trader can first use a higher timeframe to identify the broader trend and important support and resistance zones. A lower timeframe can then be used to look for price action confirmation and a potential entry. This top-down approach can help traders avoid taking a lower-timeframe trade that goes directly against a stronger higher-timeframe trend.
When Support and Resistance Fail: Breakouts and False Breakouts
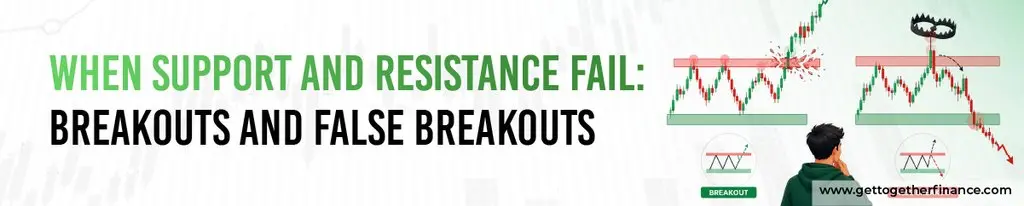
Stock markets are based on probability, and we cannot be 100% certain about our analysis unless the market moves in that direction. So, there are instances where support and resistance trading can go wrong.
- Breakout below the Support: In a downward trending market, if the selling pressure is so high that the price moves considerably below the support zone, we call it a breakout below the support. In this case, the support can become the new resistance for the share price.
- Breakout above the Resistance: In an upward-trending market, if the buying pressure is so high that the price moves considerably above the resistance zone, we call it a breakout above the resistance. In this case, the resistance can become the new support for the share price.
How can we avoid heavy losses caused in such a scenario? Well, you can do 2 things:
- You can wait for confirmation through sustained price movements to check whether the support and resistance zones are strong before placing the order.
- Place the stop loss orders carefully to avoid any shocks.
Real Breakouts vs. Fakeouts
Not every movement beyond a support or resistance zone is a genuine breakout. A real breakout generally shows stronger acceptance beyond the zone, while a fakeout may move outside the zone briefly before returning inside it.
A combination of a close beyond the zone, increased volume, sustained movement, and continued acceptance outside the previous zone can provide stronger breakout confirmation.
On the other hand, if price briefly moves beyond the zone, volume remains weak, and price quickly returns inside the previous range, traders should be cautious about treating the move as a confirmed breakout.
The Role of Volume in Breakout Confirmation
Volume can provide additional information when evaluating a breakout. A breakout accompanied by volume significantly higher than the stock’s recent average can indicate stronger participation behind the move.
However, volume should not be used in isolation. Price structure, the location of the zone, the broader trend, and subsequent price action should also be considered before deciding whether a breakout is genuine.
Range-Trading Strategy: Profiting When Support and Resistance Hold
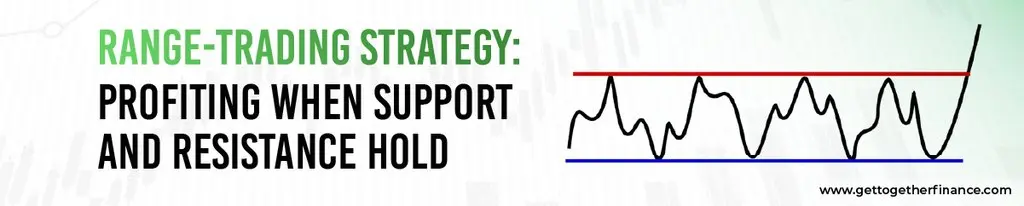
Sometimes the market does not go in the same direction. Instead, price bounces back and forth between a support zone and a resistance zone, which is known as a trading range. Most traders try to gain profits by buying near the support zone and selling near the resistance zone. But the moment the price breaks out of the range, this strategy stops working.
What Is a Trading Range?
When the price keeps bouncing between the same support and resistance zones for a while, then a trading range forms. In this, the price keeps moving up and down within the range, instead of breaking above the resistance zone or below the support zone.
Range-Trading Entry and Exit Rules
You need to follow some simple rules when trading in a range:
- Consider buying when the price approaches the support zone
- Consider selling when the price approaches the resistance zone
- Before entering a trade, wait for confirmation
- Book your profit before the price reaches the opposite zone
- Keep your stop-loss outside the support or resistance zone
Risk: Range Breakout Losses
When a price breaks above resistance or below support, trading ranges eventually end and start a new trend. If price closes outside the range with high volume, then it signals a real breakout. When that happens, it’s better to exit the trade rather than hoping for a reversal.
A lot of beginners hold onto a losing trade, expecting a reversal, but if the breakout continues, it leads to even bigger losses. It is advisable to always stick to your trading plan and get out once a breakout is confirmed. This keeps your capital safer and reduces unnecessary losses.
Common Mistakes Traders Make with Support and Resistance
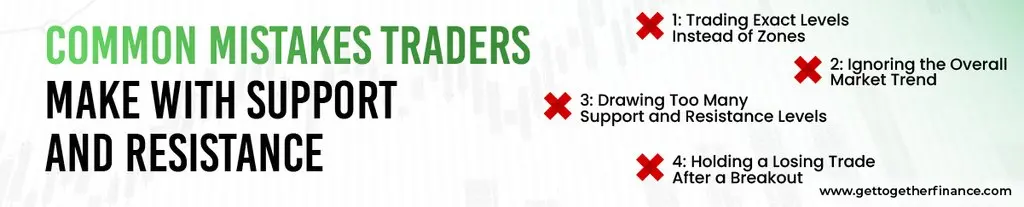
Support and resistance can look simple on a chart, but several common mistakes can affect trading decisions. Understanding these mistakes can help traders build a more disciplined approach.
Mistake #1: Trading Exact Levels Instead of Zones
One common mistake is assuming that support or resistance must work at one exact price. Markets can move slightly beyond a level before reversing. Treating support and resistance as zones provides more flexibility and reflects the way demand and supply can operate across a price range.
Mistake #2: Ignoring the Broader Trend
A trader may identify support correctly but still take a weak trade if the broader market trend is strongly bearish. Before entering a trade, check the higher timeframe trend and understand whether the setup is aligned with the broader market direction.
Mistake #3: Using Too Many S/R Levels
Marking every previous high and low can make a chart difficult to read. Too many support and resistance levels can create confusion and confirmation bias. Instead, focus on the most relevant zones and use confluence to prioritize them.
Mistake #4: Holding Through Breakouts
Another common mistake is continuing to hold a losing position simply because the trader expects the old support or resistance to work again. Once a zone breaks with convincing price action and volume, the original trading idea may no longer be valid.
Having predefined invalidation and stop loss rules can help prevent emotional decisions after a breakout.
Real-World Indian Stock Examples

Support and resistance concepts become easier to understand when applied to familiar Indian market instruments. Charts of stocks such as Reliance, HDFC, or the Nifty 50 can be used to identify zones, reactions, breakouts, and retests.
Example #1: Reliance, HDFC or Nifty 50
Consider a stock or index that has reacted around the same price area multiple times. Instead of drawing one exact horizontal line, mark the entire area where the price repeatedly found buying interest or selling pressure.
Next, observe whether the zone aligns with volume, a moving average, a trendline, or another technical factor. If the price then approaches the zone and forms a clear price action signal, the trader can evaluate the setup using entry, stop loss, target, and risk-to-reward conditions.
A subsequent breakout should also be monitored to determine whether the zone has genuinely failed or whether the move is a false breakout.
Example #2: Range-Trading Example
Suppose an Indian stock trades between a defined support zone and resistance zone for several weeks. Instead of chasing the price in the middle of the range, a trader can wait for price to approach one of the boundaries.
Near support, the trader can look for demand and bullish price action confirmation. Near resistance, the trader can look for supply and bearish confirmation. If price eventually breaks out of the range with strong volume and sustained movement, the trader should reassess the range strategy.
Before You Trade: Practice on Historical Data

It is crucial to first practise your strategy before starting to trade with real money. Historical price charts are the best way to do so, which is also known as backtesting.
Backtesting basically means checking past charts to see how a strategy would have performed. With this, you can find possible entry and exit points, verify if your analysis was right, and mark support and resistance zones.
Also, you can try paper trading, where you practise trading without using real money. It’s a great way to understand how the market works and build your confidence. Always track your trades while practising, like where you placed your stop-loss, why you entered the trade, and what the result was. This helps you identify errors and improve your trading over time.
To get started, follow these steps:
- Choose 5 to 10 stocks
- Check the price chart from the last 3 to 6 months
- Mark the support and resistance zones
- Choose your entry and exit levels for the trade
- Check whether the trade would have made a profit or a loss
- Track your win rate and learn from your mistakes
- Make changes to your strategy if needed and practise again
Additionally, you can use tools like TradingView Bar Replay to practise on old charts, and GTF EYE to easily spot key demand and supply zones.
Connecting Support and Resistance to GTF’s Demand and Supply Framework

In technical analysis, support and resistance are crucial concepts, but they are just the starting point. In order to understand the market properly, traders should also learn about demand and supply. By combining support and resistance with demand and supply trading, you can make better trading decisions.
Why Support and Resistance Work: The Demand and Supply Story
Support and resistance zones form due to the balance between buyers (demand) and sellers (supply). When buyers are more than sellers, the price rises, while when sellers are more than buyers, the price decreases.
Support and resistance show you where the price reacted before, but they do not always capture the current buyer or seller activity. That’s where Demand and Supply theory becomes valuable. Demand and supply zones go a step further than just old price levels. They help traders identify areas where big buyers and sellers are placing their orders right now. This helps traders discover stronger opportunities and improve decision-making.
From Support and Resistance Recognition to Demand and Supply Mastery
Support and resistance are core to technical analysis, helping traders spot key price zones where the market’s likely to react. The next step is to learn demand and supply trading, which helps you understand price movement, spot stronger zones, and improve your strategy.
This blog has covered the fundamentals of support and resistance. If you’re looking to bring live market analysis, Demand and Supply, Price Action, and Risk Management all together, the GTF Trading in the Zone course can help you build those skills.
Tools to Streamline Support and Resistance Identification

Manually identifying support and resistance zones can take time, particularly when traders analyse multiple stocks and timeframes. Charting tools and scanners can help streamline this process.
GTF EYE Scanner: Automated Zone Detection
GTF EYE can help traders scan the market for potential trading opportunities instead of manually checking every stock. It can assist with identifying relevant demand and supply areas and potential confluence zones.
This can be particularly useful for traders who want to reduce the time spent manually scanning charts before applying their own analysis and confirmation.
GTF Indicator 2.0: Dynamic S/R on Your Charts
GTF Indicator 2.0 can help traders bring dynamic support and resistance information directly onto their charts. Instead of manually drawing every zone, traders can use the indicator to streamline the identification process and then confirm the setup using price action, volume, trend, and broader market context.
Chart Software Recommendations
Traders can also use charting platforms to manually identify support and resistance zones, analyse price action, and review historical data. TradingView can be used for detailed chart analysis, while Finviz and broker platforms can help with quick stock screening and basic technical analysis. The choice of tool matters less than having a clear process for identifying zones, confirming trades, managing risk, and reviewing results.
Conclusion: From Zone Recognition to Profitable Trading
We have reached the end of this blog. We have discussed the basics of stock trading using support and resistance zones, traditional identification methods, demand and supply, price action, confluence, breakouts, range trading, risk management, and backtesting.
The key takeaway is that support and resistance should not be treated as isolated lines on a chart. A stronger approach is to identify zones, understand the demand and supply behind them, look for confluence, wait for price action confirmation, and manage risk before entering a trade.
If you are just starting your trading journey, begin with the fundamentals and build your understanding before moving toward advanced concepts. GTF offers different learning paths based on your current level, from the TIZ Elementary course for beginners to TIZ Live and advanced TIZ 2.0 learning.
The goal is not simply to identify more support and resistance zones. It is to understand which zones matter, why they matter, how price behaves around them, and how to make disciplined trading decisions around them.
FAQs

What are the fundamentals of support and resistance?
The fundamentals of support and resistance are based on the interaction between demand and supply. Support represents an area where buying interest can increase, while resistance represents an area where selling pressure can increase. These should generally be viewed as zones rather than exact prices.
What is the rule of support and resistance?
The basic rule is that support can act as a floor and resistance can act as a ceiling for price. However, these zones can fail. After a confirmed breakout, previous resistance can become support and previous support can become resistance.
How can I identify strong support and resistance zones?
Look for zones where price has reacted multiple times, preferably across relevant timeframes. Stronger zones can also have supporting volume, demand or supply, trend alignment, and other confluence factors.
How do I practice identifying support and resistance before risking real money?
You can practice by studying historical charts, marking support and resistance zones, and recording how price reacted afterward. Backtesting and paper trading can help you test your strategy and understand its strengths and weaknesses before using real capital.
How many touches does a zone need to be valid?
There is no fixed number that guarantees a valid zone. However, two or three meaningful reactions can provide useful evidence. The quality of the reaction, timeframe, volume, and broader market context should also be considered rather than counting touches alone.
Should I use support/resistance alone, or combine with other indicators?
It is generally better to combine support and resistance with relevant confirmation such as price action, volume, trendlines, moving averages, and higher timeframe analysis. This creates a confluence-based approach instead of relying on a single signal.
How does GTF’s Trading in the Zone course teach support and resistance differently?
GTF’s Trading in the Zone approach connects support and resistance with demand and supply, price action, multiple timeframe analysis, and market context. The objective is to help traders understand why price reacts around a zone rather than simply teaching them to draw horizontal lines.
Can I use support and resistance for day trading, or just swing trading?
Support and resistance can be used across different trading styles. Day traders may work with shorter timeframe zones, swing traders can use daily or weekly zones, and position traders may focus on broader timeframes. The key is to match the timeframe with the trading approach.
What is the difference between support/resistance levels and zones?
A support or resistance level is often represented as one price, while a zone covers a range where buying or selling activity may occur. Thinking in zones accounts for market volatility and makes it easier to interpret price reactions without expecting an exact reversal at one price.



