
Basing: What it is, How to Identify It, Different Types
- Updated on :
- 1047 Views
- by Manaswi Agarwal

 Instagram
 Linkedin
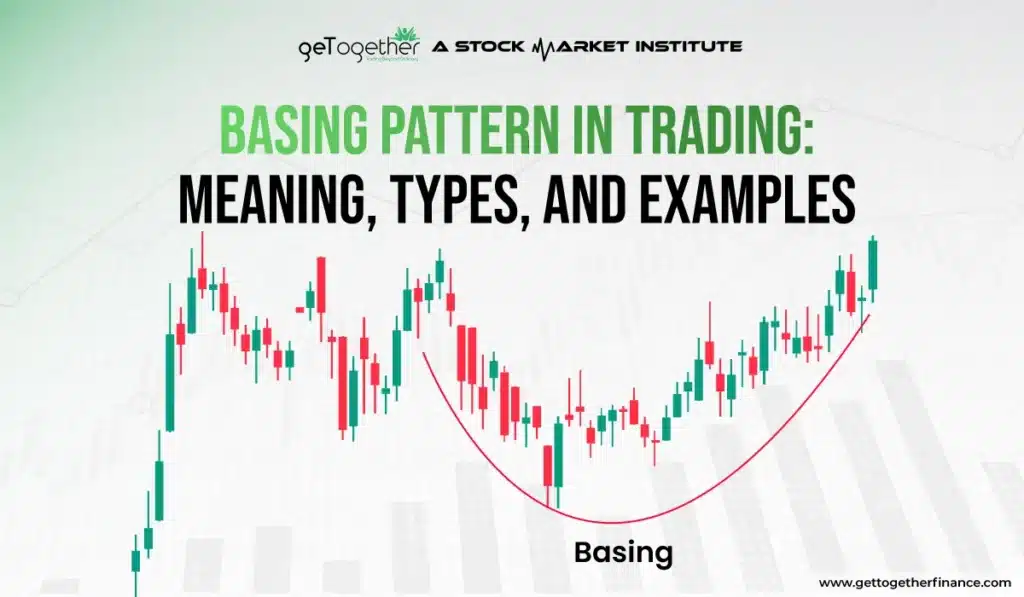
Price action isn’t always easy to read. After a strong move, a stock may consolidate in a narrow range before its next big move. This phase can show what’s going on between buyers and sellers. This is where the concept of basing comes in. It’s a period when price consolidates and settles around certain levels, while the market gets ready for its next move.
By spotting this pattern, traders can understand market structure and find potential trading opportunities. In this blog, we’ll look at what basing is, how to identify it on a chart, the different types, and how to trade it.
What is Basing?

In trading terms, basing refers to the consolidation in the price of a security, usually after a downtrend, before it begins its bullish phase. The term is often used by technical analysts to strengthen their analysis. Basing is defined as a consolidation period where the price of a stock, commodity, or index stops following an ongoing trend and moves sideways or horizontally.
In this phase, price moves within a defined range as the market pauses before its next move. When traders understand basing, they can better read price behavior and find opportunities as a stock gets ready to move out of its consolidation range.
Now that we know the meaning of basing and how it forms during consolidation, let’s look at the key signs traders can use to spot it on a chart.
How to Find Basing in the Chart Pattern?

In order to spot a basing period on a chart, traders need to look at how price moves over time. There are a few key characteristics that help traders separate a basing pattern from normal, short-term price movements. These include consolidation duration, volume changes, and the technical tools used to study price action.
Duration
When the price stays in the same range for a longer time period, it is called the basing period. The time duration of a consolidation phase in the security can vary. It might last a few weeks to several months or even longer. It is also believed that the longer the basing period, the stronger the move is expected in the price.
Trading volume
During the basing period, the trading volume is typically lower because of the uncertainty about the asset’s direction, which often leads to reduced trading activity. A spike in the trading volume signifies the end of the consolidation period and the beginning of the new trend.
Technical tools
The basing period can be identified with the help of several technical tools such as support and resistance levels, moving averages, and price action strategies. An asset that follows the basing pattern establishes clear support and resistance levels as the bulls and bears fight for control.
After understanding how to find basing in the chart pattern, it’s time to find out what it signifies.
What does Basing Signify?

The sideways market represents a stable movement in the price of the security after a significant rise or fall and before the next price moves in either direction.
This period represents that the asset doesn’t make new highs or new lows as the security trades within a confined range because traders adjust their positions and make informed decisions based on recent price movements.
Stability
Basing is useful as it signals that the market has a balance between demand and supply. Price stability is a sign of positivity for investors after a period of volatility, as it is less risky.
Prediction for Next Move
A consolidation period in securities is often followed by a significant price movement. The pattern formation helps traders to closely predict the future direction of the market, whether it will continue in the previous trend or will reverse.
Investment Opportunity
Investors have the opportunity to analyze and predict the performance of the security during the basing period and identify buy or sell opportunities. It gives traders the chance to plan their next moves based on the security’s performance.
Now that we have discussed what basing signifies, let’s now understand the base-on-base pattern and how it develops on a price chart.
Understanding Base-on-Base Patterns

A base-on-base pattern defines the combination of two bases, which is a phenomenon that starts the base formation when an asset’s price does not reflect a substantial rise from its buy point. It is a signal of a basing pattern when a new base emerges at a point higher than the previous one, which resembles two bases.
It can be seen how the base-on-base phenomenon is made out on the chart, as it looks like the steps of a staircase. The second base is a flat base, which includes a cup with or without a handle, or it can be a double bottom.
Now we have discussed the base-on-base pattern; it’s time to understand different types of basing.
Types of Basing
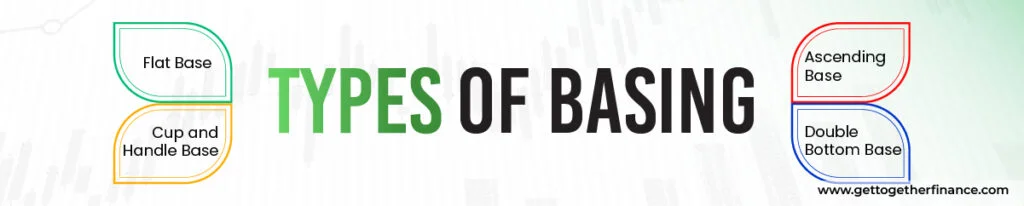
Basing patterns can look different depending on how price behaves during consolidation. Each type has a distinct structure that traders can spot on a price chart. By understanding these patterns, traders can better analyse price behaviour and potential breakouts. Bases can take various forms, which must be identified by technical analysts, as it brings several opportunities for them:
Flat Base
A flat base represents a horizontal consolidation where price moves sideways within a tight range. It gives signals to traders about a pause before a potential breakout or breakdown.
Cup and Handle Base
The cup and handle chart pattern represents a rounded consolidation (cup) followed by a smaller consolidation, which denotes the handle of the pattern. It signifies a strong continuation pattern in uptrends.
Ascending Base
An ascending base occurs with the consolidation pattern with a series of higher lows and relatively flat highs. This consolidation in the ascending base suggests accumulation and potential for a breakout to higher levels.
Double Bottom Base
In the double bottom base pattern, a “W”-shaped pattern occurs where the price tests the same support level twice before breaking higher. It signals the reversal of a downtrend into an uptrend.
After knowing different types of basing, it’s time to see how these patterns can be incorporated into potential trading strategies.
What are the Basing Trading Strategies?

When traders spot a basing pattern, they can use the price range to plan their trading setups. The strategy can differ based on whether price breaks out in the same direction as the trend or moves the other way. There are some common strategies that include trend continuation and trend reversal.
Trend Continuation
The basing period determines an entry point in a trending market and should place a trade when the price breaks above the high of the consolidated range to take a long position. Traders can take the help of moving averages to identify the support at the bottom of the basing period and catch up to the price.
When the price moves in a narrow range, traders may be able to define their risk more clearly by placing a stop-loss below an appropriate support level.
Trend Reversal
The basing period is used to find potential bottoms or tops in a security. If the price breaks in the opposite direction of the previous trend, it may indicate a potential reversal as traders respond to the changing price movement.
After learning about the strategies, now let’s look at the key points traders can keep in mind when planning a trade around a basing pattern.
How to Trade Basing?

In consolidation, patience plays a key role; the longer the basing period, the stronger the move is. A trader has to wait for the breakout to enjoy the move. Let’s understand how to trade basing:
Watch for a Breakout: Enter the trade when the price breaks above or below a particular range. Take a long or short position, respectively, to enjoy the move outside the consolidated range. Set Stop-Loss Order: Place the stop-loss orders below or above the consolidation range; if the price reverses, a trader can end up making losses.
Conclusion
Basing plays an essential role in understanding trading psychology and market structure. It shows a pause where the market adjusts to earlier price fluctuations, and helps experienced traders to position strategically for the next major move. Although basing does not confirm the market direction, it offers a high-quality approach to identify strong trading opportunities, prepare for a reversal or breakout for clarity, and assess risk.
FAQs
What is a base in trading?
A base is a consolidation pattern where the price moves sideways within a defined range after a trend. It indicates equilibrium between buyers and sellers, often preceding a breakout in either direction.
How long does a basing period typically last?
A short-term basing period may last for hours, while a long-term basing period lasts for weeks, months, or even years.
How do traders use basing in their strategies?
Traders use basing to enter positions when the price breaks out of the consolidation range and assess whether buyers or sellers are gaining control during the basing phase.
What are the different types of Basing?
The different types of basing include: flat base, cup and handle base, ascending base, double bottom base, triple bottom base, rounded base, etc.
Can basing occur in any financial market?
Yes, basing can occur in any financial market, including stocks, forex, commodities, and cryptocurrencies.
How to identify basing phases?
Basing phases can be identified by Bollinger Bands, volume analysis, and moving averages.



