
Blow-Off Top: Identifying the Indicators in Technical Analysis
- Updated on :
- 2236 Views
- by Suhani

 Instagram
Introduction
A blow-off top is a well-known bearish technical pattern that signifies the end of a powerful uptrend. It is stimulated by selling pressure and excessive market excitement. It is characterized by a rapid, sharp rise in the stock or security price and a sudden shift in the stock’s dynamics. This pattern is usually observed in the final stage of a bull rally, when buyers start booking profits out of fear of missing out, distorting buying and giving rise to a trend reversal.
Blow-off tops have been seen in various types of markets; every market that can be studied on the candlestick chart has seen blow-off tops. Cryptocurrency rallies and hype in 2017 were one of the great instances of understanding this pattern. At that time, prices of the majority of cryptos soared to unsustainable levels before crashing, wiping out significant market value.
Knowing and recognizing the signs of blow-off top patterns is crucial for investors and traders. It will help them anticipate potential market reversals with extreme profit booking and selling pressure. Let’s dive deep into this blog and learn more about the pattern.
Understanding the Blow-Off Top Pattern

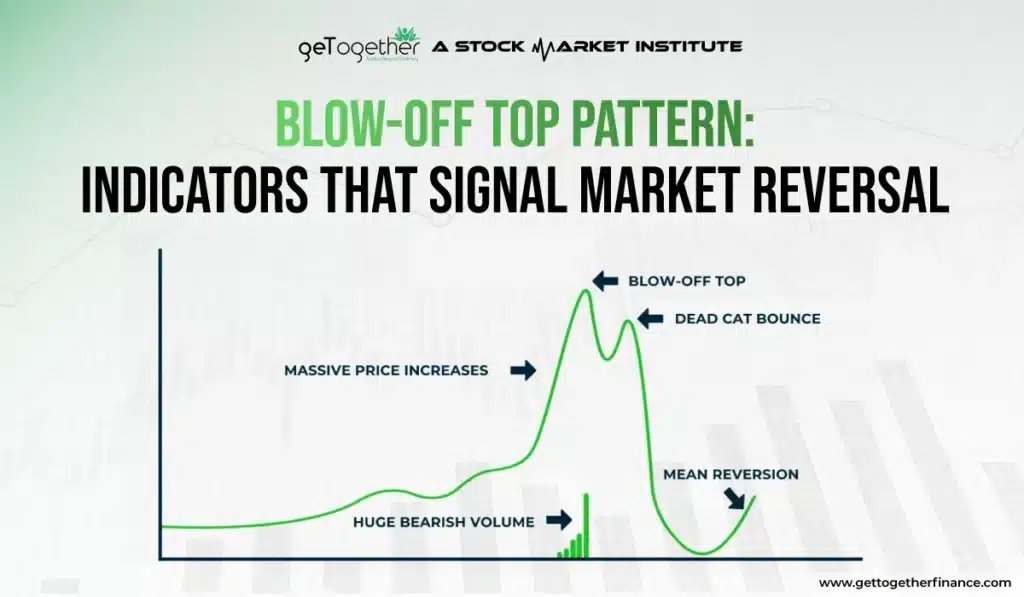
A blow-off top pattern is formed when, as quickly as the price has surged upwards, it falls down at the same pace. It’s like watching a rocket shoot up to the sky and return to Earth in no time. This pattern usually occurs after a strong uptrend, when buying activity pushes the price sharply higher in a short period. Once buyers start to weaken, selling pressure increases, and the price drops fast.
To understand how a blow-off top appears on a chart, it’s important to look at the market conditions and price movements that cause it to happen.
Formation and Characteristics
Blow-off tops form when a strong uptrend is surged with an unimaginable increase in buying, making explosive green candles and creating a sharp price rise. This often happens in a short period due to extreme buying pressure, pushing the price of an asset or stock to all-time highs. The day this uptrend ends with sharp selling with equal force, the price falls as rapidly as it rose. Catching many traders off guard. This makes the blow-off top pattern.
Phases of a Blow-Off Top
- Rapid Ascent: The price of a stock or an asset shoots up quickly with increased trading volume as everyone is eager to buy.
- Peak: The peak of the price is often reached after sudden buying and increased volatility.
- Sharp Decline: Prices fall rapidly, triggering panic selling.
Market Psychology Behind Blow-Off Tops
This type of pattern is usually driven by FOMO and greed. As prices rise, fear of missing out (FOMO) makes traders buy even at spiked rates. However, once the top is reached, fear of losing the profits takes over, leading to aggressive profit booking and selling.
Key Indicators of a Blow-Off Pattern

Identifying a blow-off top pattern can help traders and investors avoid major losses. Here are some key indicators and patterns that can help you identify it. These signs help traders spot when a strong uptrend is losing strength, and a reversal might be coming.
1. Volume Spikes
A sudden surge in trading volume is a major indicator of the pattern. As the price of the security or the stock soars, more traders rush in to enter the market, creating unusually high buying activity. This surge in volume often peaks near the high made by the price.
2. Parabolic Price Movement
In a Blow-Off Top pattern, prices rise with a very high force, creating a steep and parabolic curve on the chart. This sharp rise may be difficult to sustain, as this part of the bull run often occurs in the final stage of an uptrend before the trend may reverse.
3. Increasing Volatility
As the top approaches, price swings in the asset or stock become more extreme; this shows extreme volatility and uncertainty in the market. Large price jumps and drops within short periods signal that the trend may soon reverse.
4. Divergences in Momentum Indicators (RSI, MACD)
Divergence in some momentum indicators like RSI and MACD signals. The weakness in buying pressure shows low demand for the stock. To understand this, let’s take an example: there might be cases when the stock is making new highs, but RSI isn’t. This can be interpreted as buying is eventually declining.
5. Candlestick Patterns (Doji, Shooting Star, etc.)
There are some specific candlestick patterns that indicate a potential reversal when formed at the top of a bull rally. These are Doji and shooting stars. These patterns usually show the battle between Buyers and sellers and sometimes a single price reversal.
Read More: Bull Market Explained: Trends, Benefits & Investment Tips
These indicators can help traders spot a possible blow-off top, but they don’t confirm it on their own. Similar price movements can also happen in other market conditions. That’s why reading them correctly is so important.
Common Traps and Misinterpretations

Identifying the blow-off top pattern can be tricky; it can often be confused with normal market movements. Here are two common misinterpretations of the pattern. When traders know these differences, they’re less likely to fall for a false signal.
1. False Signals and Whipsaws
Blow-off tops can give false signals, leading traders to make impulsive and wrong decisions. For example, rapid price spikes with increased volume followed by a quick pullback can appear like a blow-off top, but it might just be another volatile market movement. This phenomenon is known as a whipsaw. It occurs when the market moves sharply in one direction and then quickly reverses. It causes traders to take trades at the wrong time, trapping them in panic selling.
To avoid this, make sure you follow a particular technical analysis strategy before getting into a trade. Indicators and volume should only be used as an add-on, not the sole indicator for a trade setup.
2. Distinguishing Between Blow-Off Tops and Regular Corrections
A blow-off top and a regular market correction can look kind of similar but have different implications. Regular market corrections come and go, and they can be a normal part of an uptrend. Short-term pullbacks often occur during long-term uptrends. Blow-off tops involve extreme price movements and emotional reactions, leading to a much faster and more uncertain fall. To distinguish between the two, look for signs of panic selling and unusually high selling activity after a strong bull run.
By understanding these traps, traders can avoid misinterpreting market signals and better navigate volatile conditions.
Once traders know how to spot a blow-off top and avoid common mistakes in reading it, the next step is to look at how to approach this setup while managing the risks involved.
Strategies for Trading Blow-Off Tops

Trading a blow-off top can turn out to be profitable if done cautiously. Here are key strategies to help navigate this volatile market condition. These strategies can help traders manage risk and make more informed trading decisions during sudden price movements.
1. Entry and Exit Points
Timing is crucial when trading blow-off tops. Traders should avoid getting into long positions when prices are already at an all-time high. At this stage, it is difficult to predict whether the price will reverse. Instead, wait for clear reversal signs and consider a short position once the downward trend is confirmed.
2. Risk Management Techniques
It is important to manage risks while trading blow-off top patterns. Since they form during highly volatile market conditions, use only a small part of your capital for such trades. Avoid adding more money to a losing trade. Also, spread your investments across different positions to reduce the impact of a single market move.
3. Using Stop-Losses and Take-Profits
Stop-loss orders are highly crucial to protect capital against sudden reversals. To be on the safer side, set stop-loss orders at certain resistance levels and also check whether the strong supply zones are broken or not. Profit and stop-loss levels should be realistically set considering the high volatility in the market.
Once the trade gets stopped out, try avoiding entering again. Also, do not increase the target unnecessarily here. You can trail your stop-loss once the price reaches the target, allowing you to lock in gains as prices move in your favor while protecting against sudden pullbacks.
4. Avoid Emotional Strategies
It is important for traders to have good emotional control over their trading behavior. In a blow-off top pattern, do not trade during the time the price starts reversing. Also, you need to avoid making quick decisions because of fear or panic.
5. Confirmation Entry
It is important to use other reliable indicators and technical analysis strategies to trade this pattern. Blow-off patterns should not be traded alone; use things as confirmation. Also, traders need to wait for multiple signs to support the trade before taking an entry.
6. Be patient and wait for re-entry
There might be times when you may miss selling at the top of the rally; now avoid getting into panic selling in between the downtrend. Wait for the price to get stable before entering. This can help you avoid taking a trade based only on fear or sudden price movements.
Conclusion
Blow-off tops are signs of market instability and can signal the end of a strong bull run caused by high buying activity and emotional trading. Many warning signs, such as volume spikes, rapid price movement, and certain candlestick patterns, can help traders identify a possible market reversal. While trading blow-off patterns can be risky, using a good strategy, setting proper entry and exit points, and putting a stop-loss at appropriate levels can help manage the risk.
Traders need to understand the psychological and technical factors behind these patterns and stay disciplined while trading. GTF does not recommend using these patterns alone; they should be used as an add-on to a complete technical analysis strategy, such as demand and supply.
Frequently Asked Questions
What is a Blow-Off Top, and how does it differ from a regular market correction?
A blow-off top is a bearish pattern. This pattern is formed with a quick and unsustainable price increase that is followed by a quick collapse of the price too. It is driven by speculative buying and emotional trading done mostly by retail traders.
What are the key indicators of a Blow-Off Top?
Volume surges, parabolic price swings, increased volatility, momentum indicator divergences (such as RSI and MACD), and reversal candlestick patterns like Doji and Shooting Star are all important indications.
How can I protect my investments during a Blow-Off Top?
To protect your investments, use risk management tactics such as setting stop-losses, avoiding new long holdings near all-time highs, diversifying your portfolio, and considering hedging measures.
Can Blow-Off Tops be predicted accurately?
While no pattern can be forecast with 100% precision, recognizing early warning signs—such as volume spikes and divergences in momentum indicators—may help traders anticipate a potential Blow-Off Top and alter their strategies as needed.
Is trading Blow-Off Tops profitable, and what strategies should I use?
Trading Blow-Off Tops can be profitable if tackled with caution. Key methods include precisely timing your entry and exit points, limiting risk with stop-loss orders and realistic profit targets, and using hedging measures to mitigate potential losses during turbulent market conditions.



