
How to Use Demand and Supply Trading: A Beginner’s Guide
- Updated on :
- 967 Views
- by Suhani

 Instagram
Overview
It’s easy to feel lost at first when learning about the many trading setups available. But among these, demand and supply trading stands out as a unique and powerful approach. Unlike traditional trading methods that exist, these techniques combine the laws of physics with market science.
But what exactly does demand and supply trading signify, and how does one effectively trade in it to build wealth?
In this blog, we are going to have a simple step-by-step understanding of demand and supply. We will first understand the basics, then learn how to identify and mark demand and supply zones. Finally, we will put together simple and effective strategies to use them for trading. To get started, let’s find out.
What Is Demand-Supply Dynamics?

Demand-supply dynamics are the universal forces that influence price changes in different markets, such as stocks. Simply put:
- Demand is the willingness or desire of buyers to buy an asset at a particular price.
- Supply is the willingness or availability of sellers to sell an asset at that price.
Prices tend to rise, leading to bullish momentum, when demand is greater than supply. Vice versa, prices fall when supply is greater than demand, which fosters bearish momentum.
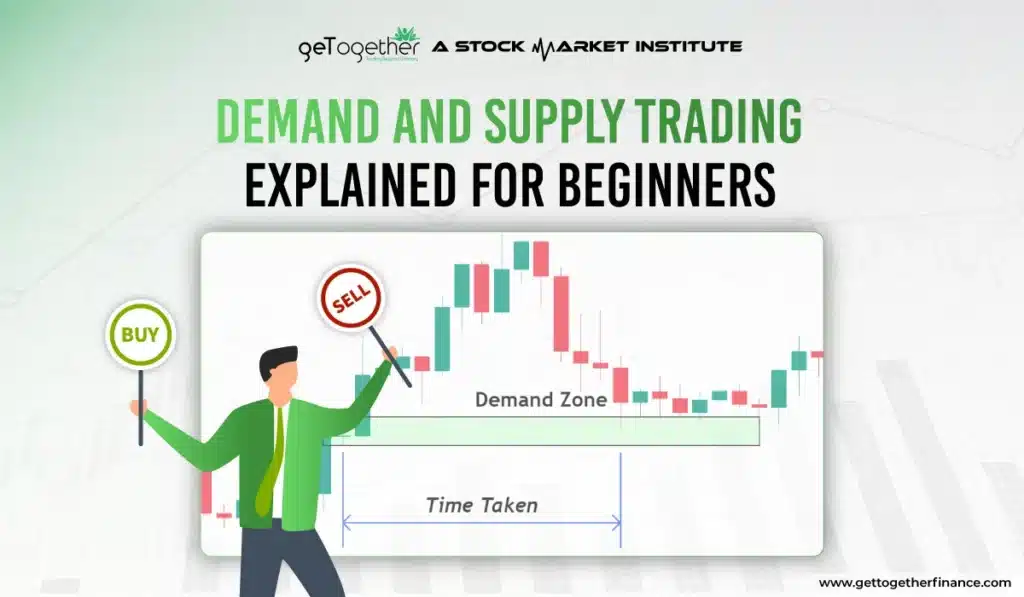
These shifts in prices allow us to identify sections on a chart that are highly likely to trigger a trend reversal or a trend continuation. These sections, which traders use as reference points to enter or exit strategies with precision, are usually termed “demand zones” and “supply zones.”
Now that we understand how demand and supply influence price movement, the next step is to understand the key terms used while identifying these zones. But before we introduce the demand and supply trading setup, it’s important to understand the fundamentals of demand and supply dynamics and the structure of a candle. Let’s take a quick look at them.
Key Terminologies of Demand and Supply Trading
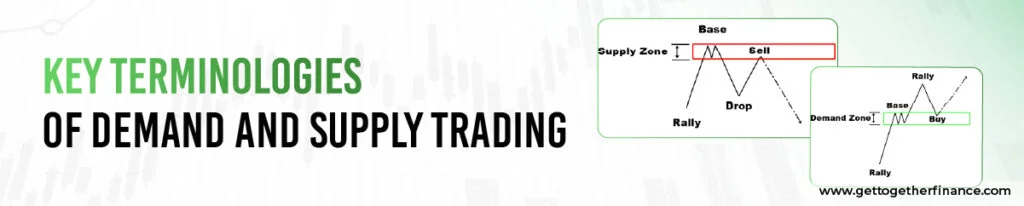
Before marking demand and supply zones on a chart, it is important to understand the basic terms associated with them.
Demand Zone: This is where buyers step in; they are the most influential players within this zone, pushing prices to a higher level. A trader’s demand zone usually follows periods of pending buy orders in the system.
Try to picture a massive wedding bonanza-themed buffet, where everyone is by the ice-cream table. Some price zones are like this buffet, a place where traders expect a lot of activity from buyers. Demand triggers when prices hit these levels, and prices bounce back up like on a trampoline.
Supply Zone: A zone where sellers are in the driving seat and prices go lower. It forms when selling pressure is strong enough to push the price downward, often creating a potential area of resistance.
Now put yourself near the end of the season sale, where sellers are losing all hope of selling anything. Many sellers cluster around those price zones, and the price moves down because of the increased supply.
Pending orders: These are the orders that are still to be fulfilled, acting as a guiding factor for the market, creating either demand or supply zones.
Once these terms are clear, we can move from understanding the zones to identifying and marking them on a price chart.
How To Mark A Zone – Demand Zone & Supply Zone

To set up a trade using demand and supply, first identify and mark the relevant demand or supply zone on the price chart. By marking these zones, traders can see where strong buying or selling pressure happened before, and they use that info to plan their entries and exits.
Here are the steps to follow when marking a demand zone:
How to Mark a Demand Zone:
To find a strong demand zone, follow these steps:
- Add a horizontal line on the current market price.
- Look over to the left and down for an explosive move (aka the very bullish (exciting) green candle).
- Now find all three components: LegIn, Base, and Legout.
To draw a zonal structure, there are two fundamental methods for outlining a demand zone:
Body-to-Wick
- Keep the proximal line on the highest wick of all base candles.
- The distal line is at the lowest wick of the base candles.
Wick-to-Wick
- Add a horizontal proximal line at the highest wick of all the base bull candles.
- Keep the distal line at the lowest wick of the base candles.
The same process can then be applied in reverse when identifying a supply zone.
How To Mark Supply Zone:
To find an exceptional supply zone, start with:
- Place a horizontal line at the current market price.
- After that, Look at left and up for an explosive drop (a big, exciting red candle).
- Obtain all 3 components: LegIn, Base, Legout.
It is possible to mark out the areas of a supply zone in two simple ways:
Body-to-Wick
- Add a proximal line on the lowest body of all base candles.
- The distal line will be on the highest wicks of all the bases.
Wick-to-Wick
- Ensure you draw a horizontal line on the lowest base wick.
- The distal line should be placed on the highest base wick.
Now that we have familiarized ourselves with the basics of marking a zone, we can move on to the next step: building a complete trading setup around these zones.
Demand and Supply Trading Setup

After marking out the demand and supply zones, the next step is to prepare your trade setup. A well-planned setup helps traders identify suitable entry points and manage their risk effectively. It also provides a clear structure for planning trades based on price movement within these zones.
Every good trade plan requires three things: an entry point, a stop-loss, and a target.
Entry Points
For Demand Zone Trades (Long Position):
You should start your entry just above the proximal line of the demand zone. This represents that you are entering the trade as soon as buyers are ready to step in.
For Instance: When the proximal line of the demand zone is at ₹150, set your entry to ₹151.
For Supply Zone Trades (Short Position):
You should set your entry slightly below the proximal line of the supply zone. This allows you to take advantage of selling pressure just as the price drops.
For instance: When the proximal line of the supply zone is at ₹300, set your entry to ₹299.
Stop-Loss Placement
Use your marked distal lines as your stop-loss point, as they should help you avoid risky price movements. Placing your stop-loss correctly protects you from bigger losses when the price falls (or rises) against you.
For Demand Zone Trades (Long Position):
Set your stop-loss just below the distal line of the demand zone. Leave a little space for potential noise.
For Supply Zone Trades (Short Position):
For a supply zone trade short position, set your stop-loss just above the distal line to ensure safety in case of an unexpected price breakout.
For example, if a distal line is set at Rs.320, the line can be secured at Rs.322. Similarly, if the distal line is set at Rs.140, the stop-loss can be placed at Rs.138, so that very minor fluctuations don’t change the trading level.
Target Setting
The target price should always correlate with a reward-to-risk ratio of 2:1. This target price needs to be two times higher than the entry point minus the stop-loss.
If the stop-loss is placed at Rs. 138 and the entry point is set at Rs.150, it gives you a Rs.12 margin, so the new target is flexible to Rs.174 after quickly adding the Rs.24 procurement cost.
Important Note: If a trade setup doesn’t provide a better reward ratio (minimum 2:1), there is no need to act on a trade that holds minimal returns and greater risks.
Why This Setup Works

This method gives traders a structured way to trade because it helps them define their risk and potential reward before they even enter a trade. It makes sure:
- You put a loss limit with an SL on the distal line.
- It keeps you disciplined because you only take a trade when the potential reward is worth the risk.
- When you decide your entry, stop-loss, and target beforehand, you can follow your plan properly.
- This setup also helps traders know their risk tolerance level before entering a trade.
However, no trading setup works every time. Demand and supply zones can fail too, so it’s important to manage risk properly and never risk more than you can afford to lose.
Multiple Time-Frame Analysis in Demand-Supply Trading Setup

Trading is super interesting using supply-demand principles. But it becomes more powerful when clubbed with the Multiple Time-Frame (MTF) Analysis in your strategy, as suggested by GTF Instructors.
MTF analysis allows traders to see the same asset in a different light by viewing it in different time zones. This makes it easier to identify stronger areas and confirm trends while also avoiding strategies that might jeopardize the trade.
Let’s understand how to use this approach effectively:
Why Use Multiple Time-Frame Analysis?
- Identify Major Trends: A broader trend can easily be identified using Higher time frames, which reduces the chances of trading against market momentum.
- Confirm Demand-Supply Zones: Those zones that are present or aligned in multiple time frames tend to be stronger and more reliable.
- Refine Entries and Exits: Lower time frames can really assist you in enhancing your entry and exit points.
Understanding the benefits of MTF analysis is only the first step. The next step is to combine it with demand and supply zones in a structured way.
How to Club Multiple Time-Frame Analysis With Demand and Supply

Begin with a top-down approach to study the chart, moving from a broader to a smaller view. This helps traders mark out the important demand and supply zones, understand the bigger trend, and refine their setup across multiple time frames.
Step 1: Analyze the Higher Time Frame (HTF)
Purpose: Determine the macro trend and identify stronger demand or supply zones on the HTF.
Example: A daily or weekly chart can be used to ascertain whether the price is in an uptrend or downtrend market or if it is consolidating.
Key Action: Mark predominant zones of demand and supply on this time frame.
Step 2: Move to the Intermediate Time Frame (ITF)
Purpose: Validate the zones identified in the higher time frame and mainly confirm your trend on the intermediate time frame.
Note: If the market is sideways, ignore entering a trade and wait for the market to confirm the next trend.
Step 3: Move to Lower Time Frames
Goal: An entry, stop loss, and target levels can be fixed here.
For instance: Find an exceptional demand or supply zone coinciding with the exceptional HTF zones. This will strengthen your trading setup, making it max to impenetrable.
Tips For Using MTF Analysis with Demand and Supply Zones

There are a few key points you should remember before using MTF analysis in your trades. By following these tips, you can make better use of different time frames and build a more structured demand and supply trading approach.
- If a zone can be seen in several time frames, that means they are more powerful and is likely to work well.
- The trade is more likely to work if higher time frames are bullish and the price is retracing to a demand zone.
- Don’t trade against the trend in higher time frames.
- Use the lower time frame to provide you with an entry slightly above the proximal line of the demand zone, or below the proximal line of the supply zone.
- Set the stop loss below or above the distal line as outlined above, keeping in mind that proper risk management practices are in place.
After identifying the right zones and planning your trade setup, the next step is to manage your risk effectively. It is important to manage risk properly to protect your trading capital and avoid unnecessary losses.
Risk Management in Demand and Supply Trading

Successful trading is built upon proper risk management. Without sufficient risk management, all the strategizing would go to waste, as a large amount would still be lost while trading. In this section, we are going to look at how trading risk can be handled to determine the size and level of positions to safeguard one’s capital.
Risk Per Trade Formula
Risk per trade means the maximum loss a trader is willing to accept if the trade moves in the wrong direction. To calculate the number of shares or quantity to trade, you can use the following formula:
Quantity = Risk Per Trade ÷ Entry Price (GP) – Stop Loss (SL)
Risk Per Trade Based on Experience Level
Ideally, a trader should manage their risk by keeping their position size at only 1% of the overall investment. Here, GTF has segregated risk levels based on expertise in the market:
- Beginners: 1% total capital of the allotted trading capital.
- Intermediates: 1.5% of allocated capital
- Pro Traders: 2%
Once you know how much you’re willing to risk on a trade, the next step is deciding how much money or how many shares to put into it. This is called position sizing.
Position Sizing
It’s basically a technique to manage your capital while trading. It helps you achieve the following:
- Determining Trade Size: According to the risk proportion above. Do not invest more than 1% of your capital in each trade.
- Adjusting for Market Conditions: In times when the market is very volatile, it is advisable to lower your position size. This helps to avoid exposing yourself too much.
Step-by-Step Example of Risk Allocation
Scenario
Capital: ₹1,00,000
Risk Level (Beginner): 1% of ₹1,00,000 = ₹1,000
Entry Price: ₹150
Stop Loss: ₹140
Risk Per Share: ₹150 – ₹140 = ₹10
Quantity to Trade:
Quantity = Rs 1000/10 = 100 Shares
This means 100 shares can be traded in this setup without risking more than Rs 1000 of trading capital.
Key Risk Management Rules
Here are some key risk management rules that a trader needs to follow to protect their capital and manage potential losses effectively:
- Stick to Your Risk Level: Make sure never to risk more than the percentage of capital you resolved on.
- Avoid Overtrading: By setting limitations on the number of trades you can make, you are able to preserve your capital longer.
- Follow the Stop-Loss: Always respect your stop-loss to ensure early losses are kept to a minimum.
Example of MTF, Risk Management with Demand and Supply

Let’s say you are analyzing a stock using multiple timeframes to identify a potential trade setup. The higher timeframe helps you identify the demand zone, while the lower timeframes help confirm the price action and entry.
Here’s how the setup can look:
Daily Chart (HTF): Shows there is a demand zone around ₹500–₹520.
1-Hour Chart (ITF): A price retrace into the identified zone with a lot of selling momentum is confirmed.
15-Minute Chart (LTF): The price action shows a bullish engulfing pattern around the ₹515 level, which is good for entry.
Trade Setup:
Entry: ₹516 (just above the proximal line).
Stop Loss: ₹505 (below the distal line).
Risk Per Trade: ₹1,000 (1% of ₹1,00,000 capital).
Position Size:
Quantity = ₹1,000 ÷ (₹516 − ₹505) = 90.9 ≈ 90 shares
Target: 2:1 Risk-to-Reward Ratio = ₹ 538
This setup keeps your loss within your set risk limit, and gives you a clear entry, stop-loss, and target based on the demand zone.
The Golden Rule Is: Never Risk It All

Always keep in mind that discipline plays an important role in trading. By managing your risk and position size properly, you can control potential losses better and stay ready for unexpected market moves. Never put too much capital on one trade because even the best-planned trades can still go wrong.
Before entering a trade, decide on a clear risk limit and follow it strictly, without letting your emotions mess with your decisions. Trading is a marathon, so being disciplined about risk management protects your money and keeps you in the market long-term. When you focus on consistency rather than chasing quick profits, it becomes easier to build good trading habits and feel more confident with each trade.
In A Nutshell
Trading in demand and supply is one of the most effective and easy techniques that allow traders to trade in and out of a market. Determining the locations where buying and selling thrive ensures that you preemptively avoid losses that the majority of traders suffer.
Using a broad range of tools like moving averages combined with multiple time-frame analysis, price-action analysis, or even a top-down approach, you can increase the effectiveness of your demand and supply trade setup. With an enhanced understanding of market dynamics, these, coupled with self-disciplined risk management, can lead to minimal losses and maximize gains regardless of whether you are a novice, an intermediate, or a professional trader.
However, understanding these concepts is only the beginning. Applying them consistently through practice is what helps traders become more familiar with demand and supply setups.
But to learn more about the strategies above and how to use them practically, you can refer to the Trading in the Zone – Elementary Course, available on YouTube for free, or explore GTF’s full range of trading courses online for structured, mentor-led learning.
GTF also provides lifetime mentorship support and the GTF indicator (automatically detects zones and more) to its students in the Trading in the Zone—Advanced course, which can be beneficial for someone looking for guidance while practicing. To take your zone-detection accuracy even further, learn how combining GTF EYE with the GTF Indicator helps you scan for high-probability demand-supply setups across multiple stocks simultaneously.
FAQs
How do supply and demand zones differ from support and resistance?
Support and resistance are horizontal price levels, while supply and demand zones are areas with higher buying or selling pressure, often forming larger zones.
What is the significance of historical price data in understanding demand-supply dynamics?
Historical data helps traders identify patterns and trends that can be used to spot high buying zones and inform future trading decisions based on past behavior at specific price levels.
What is the Big Bull Approach?
Introduced by GTF, the Big Bull Approach focuses on leveraging demand-supply dynamics to make informed trading decisions, particularly by identifying undervalued stocks.



