Options Chain Analysis: A Complete Guide to Reading the Data (2026)
- Updated on : June 24, 2026
- 3753 Views
- by Arun Singh Tanwar

 Facebook
 Instagram
 Youtube
Introduction
In the world of options trading, gaining a competitive edge can make all the difference. One powerful tool that experienced traders utilizes is options chain analysis. By examining the options chain, traders can extract valuable insights about market sentiment, trends, and potential price movements. In this article, we will delve into the intricacies of options chain analysis, demystifying its key components and highlighting its significance in informed decision-making.
Understanding Options Chains
An options chain is a comprehensive listing of all available options contracts for a particular underlying asset, such as stocks, ETFs, or indices. It provides traders with a detailed overview of various strike prices, expiration dates, OI data, changes in OI data, IV, and volume. Analyzing an options chain can help traders gauge market expectations, identify potential support and resistance levels, and uncover profit opportunities.
Option Chain Matrix
An option chain also known as an option chain matrix is the list of options available for a certain security. It lists all puts and calls available for the underlying asset with their volume, LTP, OI, strike price, bid price, ask price, and expiration date. There are four columns in the option chain matrix that traders can focus on for finding an excellent options trade setup:
- Latest trade price column- It displays the last traded price of the option (call and put both)
- Net Change Volume- The net volume change represents the change in buying and selling of the underlying asset.
- Bid Column- It shows the availability of the buyers for a particular price.
- Ask Column- It shows the availability of the sellers for a particular price.
Key Components of an Options Chain
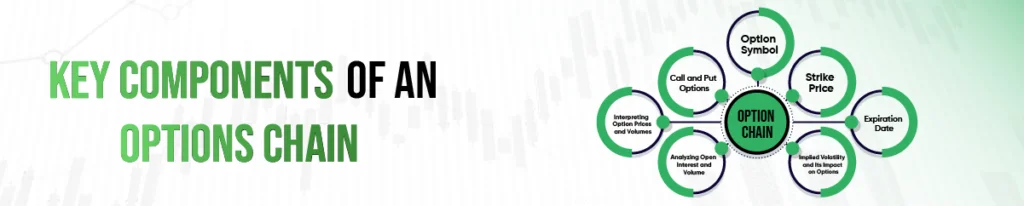
Let’s explore the essential elements found within an options chain:
Option Symbol:
Each option contract has a unique symbol that identifies the underlying asset, expiration date, and strike price. This symbol helps traders differentiate between different options and facilitates accurate analysis.
Strike Price:
The strike price is a prearranged price at which the underlying asset can be purchased or sold when an option is exercised. It is a key factor in determining the potential profit in the selected options contract.
Expiration Date:
Options have an expiration date, indicating the last day on which the contract can be exercised. Different expiration dates offer varying timeframes for traders to capture potential price movements. This helps traders to remain informed about the expiry and many more factors which can affect their options trade.
Call and Put Options:
Options chains consist of both call and put options. Call options give the holder the right to buy the underlying asset, while put options grant the right to sell it. Understanding the distinction between these options is vital for effective analysis. As this provides many insights such as volume, OI (open interest) etc.
Interpreting Options Prices and Volumes:
Option prices and volumes are essential data points in options chain analysis. options prices help to identify the authenticity of contracts by considering factors such as Implied volatility ( IV ) and more. Volume data helps determine the level of interest or activity in specific options contracts, indicating potential areas of focus.
Implied Volatility and Its Impact on Options:
Implied volatility is a measure of the market’s expectations for future price fluctuations. Higher implied volatility indicates greater uncertainty, leading to increased options premiums. Traders analyze implied volatility to assess options’ perceived risk and potential profitability.
Analyzing Open Interest and Volume:
Open interest refers to the total number of outstanding options contracts for a particular strike price and expiration date. By monitoring changes in open interest and volume, traders can gain insights into market sentiment and identify areas where significant buying or selling pressure exists. Traders majorly use it for indices such as bank nifty and nifty.
How to Read an Options Chart
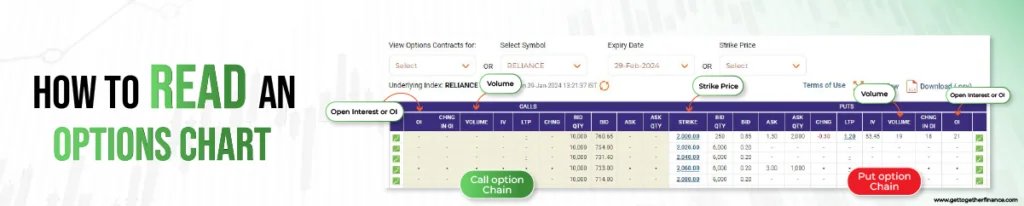
The options chart comes with a list of all available options for the stock or underlying asset. Different elements in the charts need the trader’s focus for a better understanding of options. Well, the enigma of these element or option charts is not so tough, here’s how you can read it easily:
Option Type:
There are two types of options; call options and put options. Traders buy the call option and sell the put option when the market outlook is bullish. On the contrary, traders buy the put option and sell the call option when the market outlook is bearish.
Market Sentiment
Firstly, you need to analyze the market outlook with the help of technical analysis. You need to be sure whether the market is going bullish, bearish, or going to remain neutral for some time.
Strike Price
The strike price on an options contract is the price at which the underlying security can be either bought or sold once exercised.
Open Interest or OI
Open Interest refers to the interest of traders at a certain strike price. The bigger the OI, the greater the traders’ interest in an option’s actual strike price. If the strike price has increased interest then it may become tough for the underlying asset to cross that point.
Volume
The volume shows the number of contracts bought or sold for the particular strike price. The increased interest of traders leads to increased volume.
At last, reading the option chain is necessary, but you need to master the advanced technical analysis to take the help of options chain elements. How you choose to build that skill matters – this comparison of Self-learning vs. online trading classes weighs up whether teaching yourself or learning in a structured class gets you there faster. The price movement depicted by the candlestick chart is a major indicator of future movements. Use all option chain analysis as an add-on to your technical study, do not rely on them wholly.
Also Read: Bid-Ask Spread
Usage of Option Chain
Option chains are financial tools for derivatives trading. The matrix of calls and puts along with trading tools like Implied volatility and options Greeks. They give a better understanding of trader sentiments for the particular underlying asset and its options at a given point in time.
Mainly, the option chains are used for analyzing the option strength with the help of its OI and volume. High OI of particular strike prices indicates that institutions have shorted their positions. It indicates that it may be tough for the underlying asset to cross that price point.
For instance, currently, NIFTY is at 20000, now there is a call option for 20200 with high OI, which means institutions are expecting that the market will not go above the 20200 mark. The same happens in the scenario where there is a put option of 19800 with a high OI, which means institutions are anticipating that the market will not go below the 19800 mark.
The options chain is crucial for investors and traders to make informed trading decisions. But, to get a sure shot at trades in the market, align your technical analysis with option chain analysis. It helps in assessing market sentiments, risk tolerance, and capital positioning all with a practical and reliable approach.
NOTE: When you are analyzing the stock chart with the help of demand and supply theory, there is no use in reading options chains based on the depth of OI and volume. You can enter into trades solely based on your analysis of demand and supply.
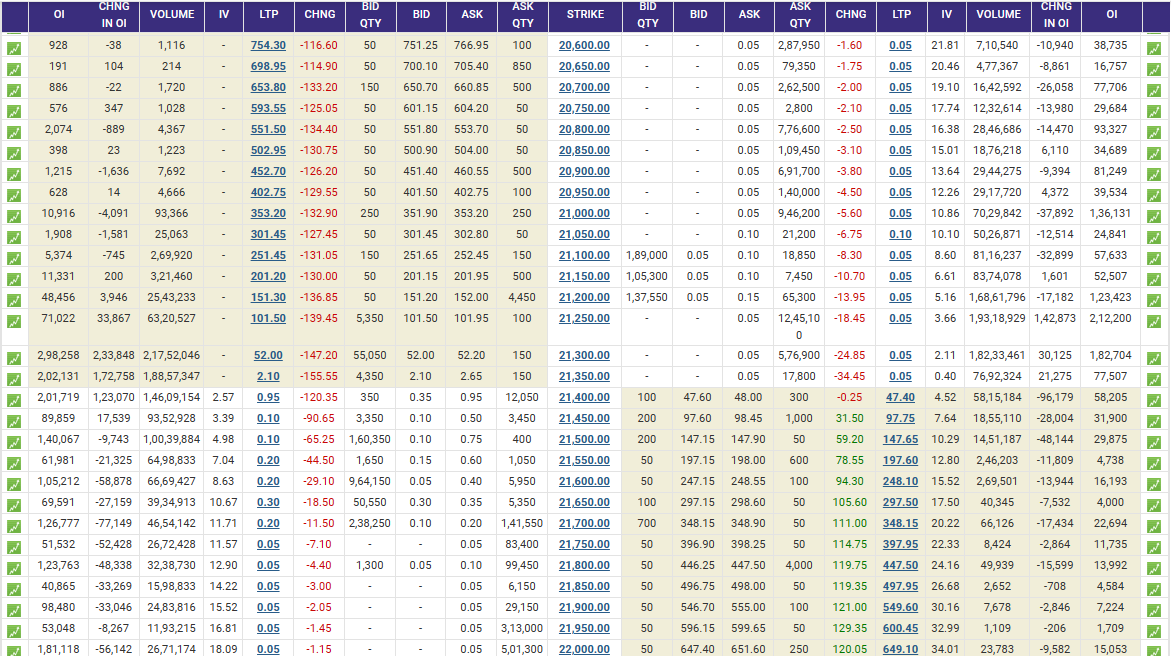
Option Chains Example
As mentioned above, the options chain can be described as a list of all option contracts. It comes in two sections: call and put with buy and sell options for both. A call option is a contract that grants you the right but does not oblige you to buy an underlying asset at a specific price and before the expiration date. Here’s what the option chain looks like.
Role of Option Chain in Intraday vs Positional Trading

Let’s understand the role of the option chain in trading:
| Parameters | Intraday Trading | Positional Trading |
| Main use of Option Chain | Show quick OI shifts and short term sentiment | Understand long term sentiment and broader market structure |
| Timeframes Focus | Minutes to hours | Days to weeks |
| OI Importance | Intraday OI change is important | Multi-day OI trends and monthly positioning give stronger signals |
| Market Noise | Higher noise, quick reversal | Lower noise, clearer structure |
| PCR Role | Detect rapid changes in trader sentiment | Present sustained sentiment over time |
| Price+ OI Interpretation | Helps in identifying quick trend moves and breakout points | Helps to validate swing trend direction |
| IV Signal | IV strikes/IV crush– short term breakout | IV cycles– Significant price moves taking shape |
| Premium Behaviour | Rapid premium decay (mainly expiry) | Slowly decay, so the broader trend carries greater weight |
| Objective | Grab short term setups and quick price movie | Take advantage of swing trade opportunity and big market moves |
| Level Identified | Nearest resistance/supportzones | Strong S/R level and larger OI clusters |
| Strike Behaviour | Rapid movement of OI around at-the-money strikes | Strategy strike position at major level |
“Options are not about estimating price, but about understanding exposure”–Nassim Nicholas Taleb.
Option Chain vs Price Action: Key Differences
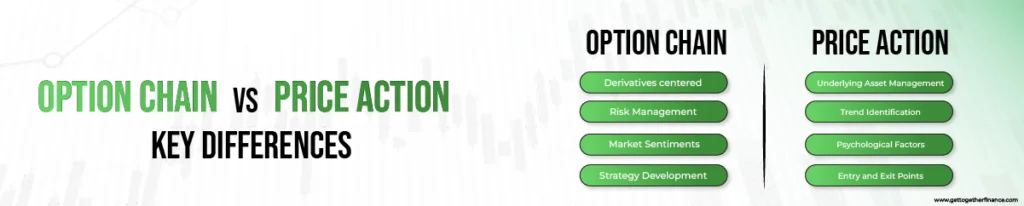
Option chain and price action are two different approaches used in the stock market for trading and investing. Both have different methodologies for different purposes. Here are the key differences between them:
1. Option Chain
All its data is derived from the movement of its underlying asset, it can be stock or commodity. Here are its functions:
- Derivatives centered: The option chain focuses on derivatives that involve call and put options. It has a certain expiry date and is highly impacted by the slight movement in the market.
- Risk Management: Traders use option chains to manage their equity holdings and hedge against unfavorable market conditions. Options are assessed based on market conditions and risk tolerance of the trader.
- Market Sentiments: The option chain clearly reflects the market sentiments with its indicators like OI, Volume, Option Greeks, etc. They depict how traders are anticipating the market.
- Strategy Development: Investors use option chains to develop risk-reward strategies, such as covered calls or protected puts, in a variety of market circumstances.
2. Price Action
Price action is based on technical analysis of candlestick charts, it can be done for both derivatives and cash securities. Here’s how it functions:
- Underlying Asset Management: Price action analysis analyzes the history and current movements of the underlying asset’s or the stock’s price, frequently utilizing charts and technical analysis and demand and supply.
- Trend Identification: Traders look at price patterns, demand, and supply zones, and chart formations to spot trends and potential reversals.
- Psychological Factors: Price action considers market psychology, emphasizing the importance of key price levels with good zones and patterns of candles as indicators of institutional behavior.
- Entry and Exit Points: The entry and exit points are very well assessed by the trader with the help of candlestick patterns.
In summary, while option chains provide information on options and market sentiment, price action analysis focuses on the movement of the underlying asset as well as the psychological aspects of market behavior. A good trader needs to use both tactics to get a thorough grasp of market dynamics and make informed investments.
How to Identify Support and Resistance Using the Option Chain

The option chain is one of the most reliable ways to identify market-backed resistance and support levels, as it shows where option writers are taking positions. These include:
1. Identify Support using Put OI (Open Interest)
Generally, Put writers sell puts at a level where they think the market will not fall below. Areas with heavy Put OI usually behave as strong support zones.
Checklist for Support
- Highest Put OI– Strongest support
- Strongest Put OI– Support is getting stronger
- Put Unwinding (OI falling)– Support weakening
- PCR > 1 at that strike
2. Identify Resistance using Call OI
Call writers sell Calls at levels where they believe the market will not go above. Thus, high Call OI zones act as a resistance level.
Checklist for Support
- Highest Call OI– Strongest resistance
- Strongest Call OI– Resistance strengthening
- Call Unwinding (OI decreasing)– Resistance weakening.
- PCR < 1 at that strike- Indicate selling pressure around that level
3. Use OI Change (last updated) for Confirmation
The critical data is not total OI but incremental OI.
Fresh Put OI build-up
- Buyers stepping in—Support strengthening
Fresh Call OI build-up
- Sellers active- Resistance strengthening.
- Put Unwinding+ Call addition.
- Downward breakdown setup
- Call Unwinding+ Put addition at the same strike.
- Potential upward breakout
4.Combine Support + Resistance for a Clear Market Range
- If the highest Put OI = 22000
- And the highest Call OI = 22500
- The market is likely to stay between 22000 to 22500
- This serves as a probable zone in which the price may fluctuate.
5. Use IV (Implied Volatility) for Strength Check
- High IV near a strike: Likely move in either direction
- Low IV with high OI: Stable, strongerS/R
6. Max Pain gives Broad Support–Resistance Bias
It’s the level where option traders experience minimal loss.
It shows:
- Prices naturally move towards that level.
- A gentle zone between resistance and support
Simple Formula:
Support = Strike with maximum Put OI
Resistance = Strike with maximum Call OI
Using Options Chain Analysis in Trading Decisions
Options chain analysis serves as a valuable tool in making informed trading decisions. it gives you add-on confirmation that you are choosing the right path for yourself while trading By integrating the insights derived from options chain analysis with technical analysis, traders can enhance their understanding of the market and make more accurate predictions.
Option Chain Analysis Strategies for Traders

Here are the most efficacious Option Chain Analysis Strategies that traders utilize to understand market strength, potential, reversal and direction.
- OI (Open Interest) Build-up Strategy
Observe the level where OI is rising.
How it helps:
- Call OI increasing– Resistance strengthening.
- Put OI increasing– Support strengthening
- Call Unwinding– Resistance weakening
- Put Unwinding– Support weakening
Use
- Identify resistance, live support and possible breakout points.
- Max Pain Strategy
Max pain = It’s the level where option writers experience minimal loss.
Use
- Not effective on its own; combine it with OI analysis for better accuracy.
- Assist in identifying the expiry day magnet level.
- Gives a midpoint between resistance and support
- IV (Implied Volatility) Strategy
IV shows expected volatility.
Key Setups
- Low IV+ High IV– Stable resistance/support
- High IV+ High IV– Potential breakout/breakdown
- IV Crush– After significant events (results, news)
- Support-Resistance Flip Strategy
Monitor how resistance and support level shifts on the basis of OI changes.
- Signals
- Put OI at a strike vanishes + Call OI rises– Support broken.
- Call OI decreases + Put OI increases at the same strike.
- Good for breakout entry confirmation
- Expiry-Based Strategy
Weekly expiries move fast, whereas monthly expiries show a more stable position.
Approach
- Use weekly OI for short-term and intraday trade.
- Use monthly OI to map the bigger market picture.
- PCR (Pull-Call-Ratio) Sentiment Strategy
PCR = Put OI/Call OI
Explanation
- PCR< 1 Bearish sentiment
- PCR> 1 Bullish sentiment
- Extreme PCR level– Reversal signals
Use
- Understanding market psychology and identifying signs of trend fatigue
- Change in OI (Fresh OI Addition) Strategy
Track real-time OI shift rather than depend solely on total OI.
Indication
- Fresh Call OI+ Increasing price– Uptrend weakening.
- Fresh Put OI+ Increasing price– Strong uptrend
- Fresh Call OI+ Decreasing price– Strong downtrend
- Fresh Put OI+ Decreasing price– Downside weakening
- Strike Shift Strategy
Monitor where OI shifts.
Indication
- Call writers move to higher strike- Bullish sentiment.
- Both move outwards–Expansion–Trending market
- Put writers move to lower strikes– Bearish sentiment.
- Both move inward– Contraction–Range-bound market
- OI Cluster Strategy
Cluster of OI at nearby strikes reveals strong supply and demand zones.
Use
- Identify multi-layer support (stacked Put OI)
- Find the compression zone before the major shift.
- Identify multi-layer resistance (stacked Call OI)
- Premium Decay Strategy
In a range-bound market, option traders generally take control.
Use
- Assist in avoiding additional irrelevant direction trades.
- Look for high OI+ decreasing premiums- sideways range.
- Good for selling strategies (strangles/straddles), if experienced
Combining Option Chain with Technical Indicators

When option chains are combined with technical indicators, it becomes a powerful tool to confirm breakout tools, reversal or trends. These include:
- Trend Strength and Direction
Option Chain Insight: PCR trend, strike shifting and fresh OI addition
Technical Indicators: ADX, MACD
Use: Confirms that bearish/bullish OI signal matches trend signal
Example: Increasing Call OI+ MACD bullish crossover– strong uptrend confirmation
- Volatility Assessment
Option Chain Insight: IV crush after event, Implied Volatility (IV)
Technical Indicators: Bollinger Bands, ATR (\Average True Range)
Use: Analyse volatility level to improve the timing of your trades.
Example: Low IV+ Low ATR– sideways market; consider premium trading strategies
- Momentum Trades and Intraday Scalping
Option Chain Insight: Strike shift near ATM, fresh intraday OI additions
Technical Indicators: Momentum Oscillators, VWAP, short-term EMAs
Use: Find out immediate opportunities for momentum or scalping trades.
- Resistance and Support Confirmation
Option Chain Insight: High Put OI= support, High Call OI= resistance
Technical Indicators: Trendlines, Pivot Points, Moving Averages (50/200 day)
Use: Ensures that OI signals are in sync with resistance levels and technical support
Example: If a 15000 strike has high Put OI and also aligns with DMA support– Strong buy zone
- Breakout and Breakdown Signals
Option Chain Insight: S/R flips, OI clusters
Technical Indicators: RSI, Price Channels, Bollinger Bands
Use: Support potential reversal points and breakout.
Example: Price breaking upper Bollinger Bands+ high Call OI unwinding– breakout likely
- Reversal Detection
Option Chain Insight: Sudden OI unwinding, extreme PCR levels
Technical Indicators: Candlestick Patterns, RSI, Stochastic Oscillators
Use: Identify oversold/overbought conditions, matching option sentiment.
Example: PCR > 1.5+ RSI above 70– Possible short-term market reversal
Pro Tip: A low or high Put-Call ratio only works when the price trend supports a sentiment shift
Common Mistakes in Option Chain Analysis
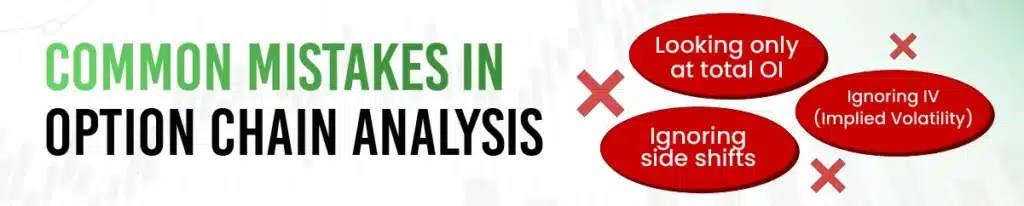
These are the common mistakes that traders make in option analysis:
- Looking only at total OI
- Ignoring IV (Implied Volatility)
- Treating max plan as a guaranteed level
- Not checking volume along with OI.
- Ignoring side shifts
- Trading against a strong OI cluster
- Overreacting to one candle or one OI strike
- Mixing spot OI with future views
- Not considering the time to expiry.
- Misreading unwinding
- Looking at the OI of the illiquid strike
- Ignoring PCR extremes
- Not checking for event days.
- Misinterpreting OI without price action
- Assuming high OI always means strong resistance/support
Pro Tip: Fresh OI addition reveals new conviction, while existing OI may just be an old position
Dangers and Limits of Options Chain Examination
While option chain examination gives significant bits of knowledge, recognizing its intrinsic dangers and limitations is important. Options prices can be influenced by a variety of factors, and market conditions can shift rapidly. Traders shouldn’t just rely on options chain analysis to make decisions about trading. To ensure a comprehensive analysis, it is essential to take into account additional technical indicators.
Conclusion
Options chain analysis is a potent instrument that provides traders with useful insights into market sentiment, trends, and potential price movements. Traders can increase their chances of success in the volatile world of options trading by thoroughly examining the options chain. options chain acts as an add-on confirmation for your options trades.
FAQs
Q1. What is Option Chain Analysis?
Option chain analysis involves studying and analyzing the matrix of call and put options for an underlying asset or the stock. Traders look onto various strike prices and expiration dates of options to make informed decisions on different options strategies. Key options indicators such as implied volatility, option greeks and open interest help in understanding market sentiment and further predicting next market movements. This analysis aids in risk management, strategy development, and understanding potential price movements in the options market.
Q2. How does option chain analysis help in predicting market trends?
Option chain analysis helps in forecasting market trends by providing insights into market and traders sentiment and expectations. Traders can analyze the current open interest, implied volatility, and strike prices to get a clear view of their trade. This information helps in predicting potential price movements, allowing traders to make informed decisions on market direction and trends.
Q3. Can you explain the key components of an option chain?
The key components of an option chain are implied volatility, option greek, strike price, volume, call and put prices, and open interest.
Q4. What role does implied volatility and open interest play in the option chain?
Implied volatility reflects market expectations for future price movement, crucial for assessing potential profitability in the options trade. Open interest measures the number of pending orders and the interest of traders in a particular trade, indicating market activity and liquidity. Both factors in the option chain inform traders about market sentiment and potential price movements.
Q5. How do traders use option chain data to make informed decisions?
Traders use option chain data to make informed trading or investment decisions by analyzing expiration dates, strike prices, implied volatility, option greeks, and open interest. This information helps in selecting apt option trading strategy, risk management, and understanding market sentiment, enabling traders to anticipate price movements and optimize their positions in the options market.
Q6. What are some common strategies derived from option chain analysis?
Common strategies derived from option chain analysis include covered calls, protective puts, straddles, and strangles. Traders can use specific options with different strike prices and expiration dates to manage risk, generate income, or speculate on price movements on the underlying asset.
Q7. How does option chain analysis differ from technical analysis in trading?
Option chain analysis is about evaluating the matrix of call and put options for an underlying asset, by seeing strike prices and expiration dates. It provides insights into market sentiment and potential price movements for an underlying asset. In contrast, technical analysis involves studying historical price data and candlestick chart patterns to identify trends and key levels, by focusing on the psychological aspects of market behavior. Both approaches offer distinct perspectives for traders. Combining technical analysis and option chain analysis can benefit a trader immensely.
Q8. What impact can option chain analysis have on risk management in trading?
Option chain analysis significantly impacts risk management in trading by allowing traders to select and trade options contracts aligned with their risk tolerance and understanding. By analyzing and considering various strike prices and expiration dates, traders can amend strategies to optimize risk and reward, enhancing their ability to bear the dynamic nature of the stock market.
Q9. Are there any specific indicators or signals within the option chain that traders commonly look for?
Traders frequently search for certain signs in the option chain, such as high implied volatility, low theta decay, or big fluctuations in open interest. Unusual patterns in these measurements can indicate possible market movements or shifts in sentiment, assisting traders in their decision-making.
Q10. How frequently should one review the option chain for effective market analysis?
To keep up with shifting market conditions, traders frequently check the option chain on a daily basis. Regular monitoring helps to catch changes in implied volatility, open interest, and prospective possibilities for informed decision-making.
Q11. How frequently should I examine the options chain?
Analyzing the options chain regularly is a good idea, especially before entering or exiting a trade. Keeping up with the most recent options data can give you a competitive advantage because market conditions can change quickly.
Q12. Can options chain analysis predict price movements with certainty?
Options chain analysis provides insights into market sentiment and trends but cannot predict price movements with absolute certainty. It should be used as part of a comprehensive trading strategy that incorporates other indicators and risk management techniques.
Q13. Are there any free resources for accessing option chains?
Yes, several financial websites like NSE option chain and trading platforms like Sharekhan provide free access to option chains. It is advisable to explore reliable sources that offer comprehensive and up-to-date options data.
Q14. How can options chain analysis be used in conjunction with technical analysis?
Options chain analysis can complement technical analysis by providing insights into market expectations and sentiment. By combining both approaches, traders can gain a more comprehensive understanding of the underlying asset and make better-informed trading decisions.
Q15. Can options chain analysis be used for other financial instruments besides stocks?
Yes, options chain analysis can be applied to various financial instruments, including ETFs, indices, commodities, and futures. The principles and techniques remain largely the same across different asset classes.


