
A Relatively Strong Moving Average Combination for Day Trading
- Updated on :
- 9951 Views
- by Manaswi Agarwal

 Instagram
 Linkedin
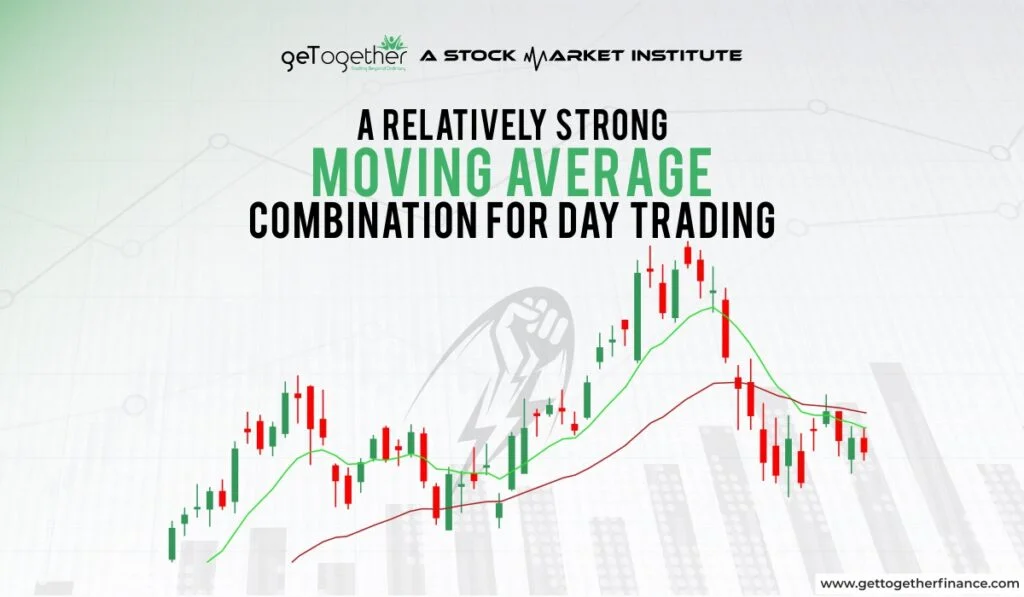
In day trading, moving averages play a major role in helping traders understand the trend of a security. A trend can be downward, upward, or sideways in the market. But how do you identify the direction of a trend? A simple technical indicator called a moving average can help traders identify the trend and understand price movements.
Moving averages can be used in different ways depending on the trading style and time frame. Therefore, understanding the different types and combinations of moving averages is important before using them in day trading. Let us take a closer look at some of the strong combinations of moving averages.
What is Moving Averages?

In the financial markets, a moving average is an important technical tool used by traders to analyze price movements and identify trends. Moving averages help smooth out price fluctuations and provide a clearer picture of the overall direction of a security.
Choosing the right moving average can add clarity to a technical analysis strategy and help traders understand whether the price is moving upward or downward. However, different moving averages work differently because they give different levels of importance to past and recent price data. Therefore, before understanding the strong combination of moving averages used in day trading, it is important to get familiar with the different types of moving averages.
Before picking a moving average for day trading, it’s important to understand how each type works and how it reacts to price changes.
Once you have understood the meaning of moving averages, let’s move on to their types.
Types of Moving Averages
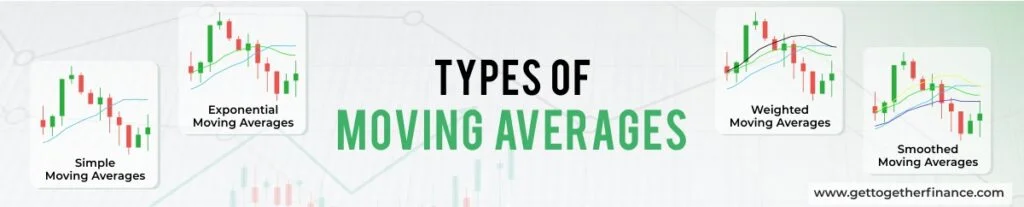
There are different types of moving averages that traders use for trend identification and analysing price movements. Some of the widely known moving averages are:
Simple Moving Averages
SMA, or Simple Moving Average, is simple to calculate as it considers the average price of an asset over a particular number of periods. Each period is given equal importance while calculating the average.
The major limitation of using SMA is that it does not give additional importance to recent price movements. For example, while calculating a 200-period moving average, all 200 periods are given equal weight, even though the most recent price movement may be more relevant to current market conditions.
Exponential Moving Averages
EMA, or Exponential Moving Average, gives more importance to recent prices compared to older prices. Because of this, it is comparatively more responsive to recent price changes than an SMA.
For example, in a 200-period EMA, recent price data has more influence on the average than the price data from the earlier periods. This makes EMA useful for traders who want to track changes in price direction more quickly.
Weighted Moving Averages
Weighted Moving Average gives more importance to recent price data and less importance to data points from the distant past. It is calculated by assigning a pre-assigned weight to the prices in a selected period and then calculating the weighted average.
Since recent prices receive more weight, WMA can respond more quickly to price changes compared to a traditional SMA.
Smoothed Moving Averages
The main purpose of using a Smoothed Moving Average is to reduce the noise created by short-term price fluctuations. It provides a smoother representation of price movements by giving more importance to the broader price trend.
It considers historical as well as recent price data, which can help traders get a clearer view of the overall trend instead of focusing on every small price movement.
After discussing the different types of moving averages, let’s now look at how traders can combine them to analyse both short-term and broader price movements.
Combination of 9-EMA, 21-EMA, and 50-SMA
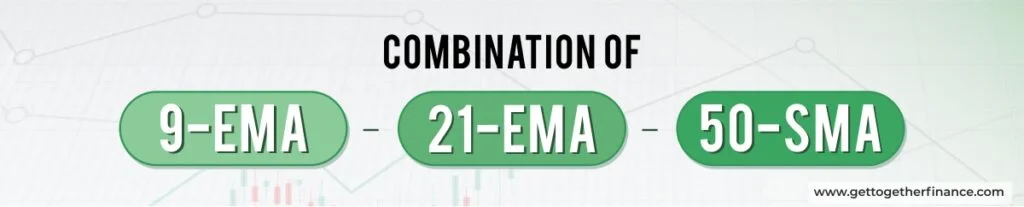
After understanding the different types of moving averages, traders can combine different periods to analyse short term as well as broader price movements.
The 9 EMA is generally used to identify short term price movements and can help traders quickly identify intraday shifts in price direction. Traders can combine this moving average with the 21 EMA, which provides a better understanding of the short to medium term trend.
The 21 EMA helps smooth out some of the short term noise and provides additional context to the movement of the 9 EMA. On the other hand, the 50 SMA gives a broader perspective of the trend and can also act as a dynamic support or resistance level during intraday price movements.
The combination of 9 EMA, 21 EMA, and 50 SMA can therefore help traders understand the relationship between short term price movements and the broader trend. When these moving averages move in alignment, traders may get a clearer indication of the prevailing trend.
However, moving averages should not be considered as standalone trading signals. Traders should also consider price action, volume, and demand and supply zones before making a trading decision.
After exploring the 9 EMA, 21 EMA, and 50 SMA combination, let’s look at some other moving average combinations that traders can consider based on their trading style and time frame.
Combination of Strong Moving Averages
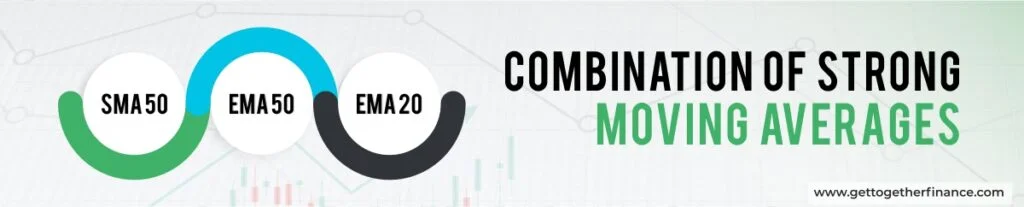
Apart from the 9 EMA, 21 EMA, and 50 SMA combination, traders can also use other combinations depending on their trading style and preferred time frame.
SMA 50: Simple Moving Average of 50 periods helps traders identify the broader direction of a trend. It can also provide a reference point for understanding the overall price structure.
EMA 50: Exponential Moving Average of 50 periods gives more importance to recent price data. As a result, it reacts faster to price changes compared to the 50 SMA.
EMA 20: The 20 EMA reacts more quickly to changes in price compared to the 50 EMA. It can therefore help traders understand relatively shorter-term price movements, while the 50 EMA provides a broader trend perspective.
The combination of these moving averages can provide traders with different levels of trend confirmation. However, the effectiveness of any combination depends on the market conditions, time frame, and trading strategy being followed.
After understanding different moving average combinations is useful, let’s look at how traders can use these combinations in practice.
How to use Moving Averages?
Once traders understand the different combinations, the next step is to understand how moving averages can actually be used in a trading setup.
EMA is mainly used as an additional confirmation tool for trades based on demand and supply zones, as these zones are an important factor to consider while taking a trade. Traders use different combinations of moving averages according to their trading style and the time frame they follow.
9-21 EMA: The combination of 9 EMA and 21 EMA is commonly used by traders who focus on short term price movements and scalping. Since the 9 EMA reacts faster to price changes, it can help traders understand immediate price movement, while the 21 EMA provides additional trend confirmation.
This combination can be applied with demand and supply zones. For example, traders can look for a potential entry near a demand zone when other factors also support the possibility of an upward price movement. Similarly, a supply zone can be considered when the setup indicates a potential downward movement.
20-50 EMA: Generally, swing traders use the 20 EMA and 50 EMA combination to understand medium-term price movements. These EMAs provide an idea about the prevailing trend by considering historical price data and can help traders understand the broader direction before taking a position.
However, the actual trade should not be based only on the moving averages. The trade setup should also be supported by factors such as demand and supply zones, price action, and volume.
To get better results in intraday trading, traders can use moving averages in combination with volume analysis and demand and supply zones. If you are taking short-term trades, faster moving averages such as the 5 EMA or 9 EMA can help in understanding short-term price movements and making faster decisions.
It is also important to backtest different moving average combinations across historical market data. This helps traders understand how a particular setup performs under different market conditions and whether it suits their trading style.
For sharper zone accuracy alongside your moving average setup, combining GTF EYE with the GTF Indicator can help automate demand and supply zone detection, allowing traders to focus more on analysing and confirming potential entries.
Once traders know how to use moving averages in their trading setup, it’s also helpful to understand what these tools can do for day trading.
After understanding how moving averages can be incorporated into different trading setups, let’s look at some of the benefits that it offer during day trading.
Benefits of Using Moving Averages for Day Trading

As a strong technical tool, moving averages help in trend identification for traders; at the same time, they also act as dynamic support and resistance levels. Moving averages determine whether prices tend to move upwards or downwards. It generates strong trading signals when used with moving averages of varying time periods.
Crossover Strategy
Moving averages generate buy/sell signals through golden crossover or death crossover, signifying bullish or bearish sentiment, respectively. Traders buy at the golden crossover and sell at the formation of the death crossover.
Flexibility
Traders have the choice to use the time period of moving averages as per their trading strategies. They have the flexibility to pick trades based on short-term moving averages, i.e., 5, 9, 20, etc. EMAs and longer moving averages, for example, 50 and 100.
Moving averages offer several benefits for day trading, but they also come with certain limitations that traders should understand before relying on them.
Drawbacks of Using Moving Averages for Day Trading
Although moving averages are useful tools for trend analysis, they also have certain limitations. Understanding these limitations is important because no single technical indicator can provide accurate signals in every market condition.
Subjectivity
Technical indicators are always prone to some level of subjectivity because there is no single “correct” setting for moving averages.
The suitable moving average period can vary depending on the trading style, time frame, market conditions, and security being analysed. Therefore, traders should choose their moving averages according to their strategy instead of assuming that one combination will work in every situation.
Varying Results
The trend might appear different on different time frames. For example, a stock may be in an uptrend on a daily time frame, while the same stock may show a short-term downtrend on an intraday chart.
This can sometimes create confusion among traders, especially if they are not clear about the time frame they want to consider. Therefore, traders should define their preferred time frame and understand how the broader trend relates to their trading setup.
Over Reliance
It can be risky for traders to completely rely on a single technical indicator for their analysis. Moving averages are based on historical price data, which means they can sometimes react after a price movement has already started.
Therefore, traders should avoid making trading decisions solely on moving average signals. Instead, they can use moving averages along with price action, volume analysis, and demand and supply zones to get a more complete view of the market.
GTF’s trading courses online cover demand- and supply-based trading methodology in depth, helping traders understand how technical tools can be used as part of a broader trading approach.
Conclusion
Moving averages can be a useful technical tool for traders looking to understand trend direction, price movement, and market momentum during day trading. Combinations such as 9 EMA, 21 EMA, and 50 SMA or 20 EMA and 50 EMA can provide different levels of trend confirmation depending on the trading style and time frame.
However, there is no single moving average combination that works in every market condition. Traders should avoid relying only on moving average signals and instead combine them with price action, volume analysis, and demand and supply zones to make more informed trading decisions.
Most importantly, traders should backtest their chosen moving average combination and understand how it behaves in different market conditions before applying it to live trades. The right combination is ultimately the one that fits the trader’s strategy, time frame, and overall approach to the market.
What does a Moving Average indicate?
A moving average is a technical analysis tool that removes the extra noise and specifies the overall trend direction of a financial instrument over a specific period.
What is a Golden Crossover and Death Crossover?
A golden crossover indicates bullish momentum in the financial instrument, while a death crossover is the representation of bearish sentiment in the security.
What type of moving averages should be considered in Day trading?
In day trading. You can consider the combination of 20-50 EMA and 50 SMA moving averages that determine the overall trend direction driving the price action.
How does SMA differ from EMA?
SMA, or the simple moving average, considers all data points equally, while EMA gives more weight to recent price movements.
Are moving averages reliable?
Moving averages are focused on identifying the trend of the security; traders must depend on a stronger approach, which is demand and supply, to make trading successful.
Is it important to use moving averages in day trading?
In day trading, moving averages help to determine the direction of the security and hence act as additional support for scalpers and swing traders.



