Understanding Trendlines in Technical Analysis: Basics, Types & Strategies
- Updated on : March 5, 2026
- 4166 Views
- by Arun Singh Tanwar

 Facebook
 Instagram
 Youtube
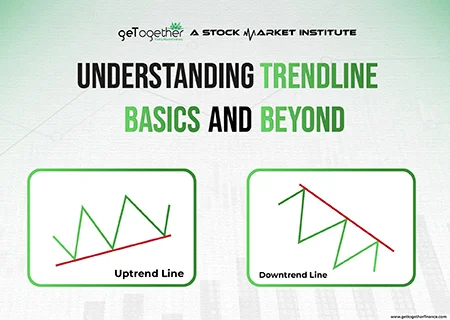
Overview
Trendlines — one of the favorite and most commonly used tools by traders. It allows users to explore market trends and psychology in many ways across different time frames. But how to read a trendline, why are they important, how to use it in investing, and are they a reliable tool? Well! We know there are so many unanswered questions. Therefore, we have loaded this blog with all the answers using plenty of examples. So stay tuned till the end.
What is Trendline?
Let’s start at the beginning. Consider it like a map for traders, suggesting the direction of the price movement. It’s a straight line that connects the dots on a price chart. These dots represent the highs and lows of an asset’s price over a specific time period. By drawing a trendline, you’re essentially connecting the peaks or valleys of an asset’s price movement. This line helps you spot trends – whether an asset’s price is going up (bullish) or down (bearish).
In Brief:
- Trendline is a charting tool that shows the current direction of stock price.
- It helps identify a visual pattern of support and resistance levels in any time frame.
- Trendline is a diagonal line on the chart used to get a clear visual of market trends and detect potential reversal points.
- Traders can select their own timeframes and points to connect when they make a trendline. It’s kind of a “you do you” situation.
What is a Trendline in the Stock Market?
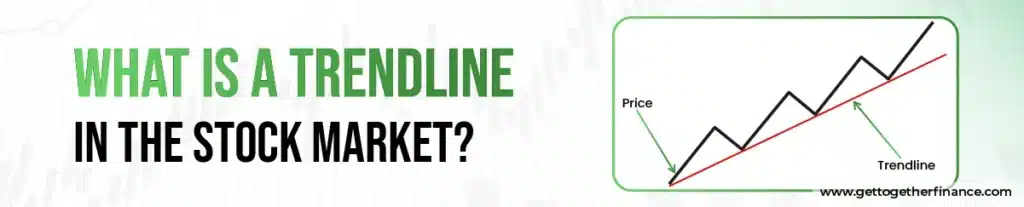
A trendline in the stock market is a simple line drawn on a price chart by connecting crucial price points, mainly highs or lows. It helps traders understand the overall market movement and identify price levels where the market may face selling or buying pressure.
Understanding Trendlines

“Trendlines work best when merged with volume and other indicators”-Steve Nison
Trendlines are an important tool in technical analysis and training. They are used to identify and confirm the direction of price in sync with the market. A trendline is a straight line that connects two or more price points (ascending in an uptrend and descending in a downtrend) and extends to the probable points where the price can go up. It gives an idea of support and resistance points in the candlestick charts. Trendlines help traders visualize the trend direction, potential price reversal points, and overall investor and market sentiments.
There are three main types of trends: uptrend, downtrend, and sideways trend. An uptrend shows higher highs made with higher lows. A downtrend shows lower highs along with lower lows, depicting that the price is
continuously falling. On the other hand, the sideways trend shows relatively equal highs and lows, showing the price is in a consolidation phase.
Also Read: Trend Analysis
Trendline Example
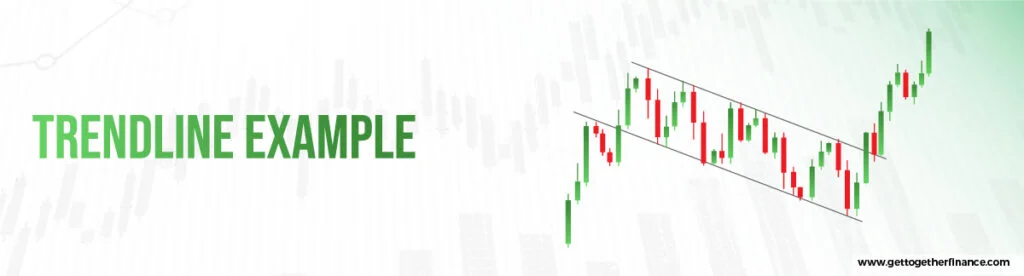
Let’s consider a stock in an uptrend. Now make a trendline line by connecting two of its concurrent lows. This trendline will act as a support level, from where there is a chance of price getting trend reversal. Now when the price of the stock approaches the support level again, there will be chances of it getting a bound back with the accumulated buying orders at the support level. Now, if the stock price touches the trendline multiple times and continues to rise from the support area, then the trendline is confirmed as a valid indicator.
Conversely, in a downtrend, connecting the lower highs forms a descending trendline, acting as a resistance level. If the price reaches the resistance level and keeps dropping from there, it helps traders to know the resistance area and take trades on the basis of it.
Trendline Breakout Strategy

A trendline breakout strategy involves identifying the timing and point where the price breaks the trendline structure and continues the trend. To take trades in this scenario, look for other technical factors. If an uptrend breaks the support trendline, look for an increase in volume, the point from where the price is coming, and take confirmation entry.
In case of a downtrend, if the price reaches the resistance level and doesn’t reverse, it eventually breaks the resistance trend line. Then this is confirmation of continuation of the downtrend. If you want to take short positions here, make sure that trading volume in buying decreases and selling is exorbitant and aligns with your trading strategies and analysis, then go for the trade. You can use additional technical indicators, such as moving averages or RSI, to enhance the accuracy of breakout signals.
How to Draw Trendlines in Technical Analysis

- Identify the Trend: the first and foremost thing is to determine the direction of the market. Whether it is an uptrend or a downtrend of a sideways. Do it by making the right price points and doing multiple time frame analysis.
- Choose Points: Select at least two significant price points that define the trend. For an uptrend higher highs will make an ascending trend line, and for a downtrend, lower lows will make a descending trend line.
- Draw the Line: Using charting software, draw a straight line connecting these points and extend it into the future.
- Adjust as Needed: As new price points emerge, adjust the trendline to ensure it remains relevant and accurate.
- Confirm Validity: Look for multiple touches on the trendline without the price breaking it to confirm its validity.
By mastering the use of trendlines, traders can gain insights into market dynamics and make informed trading decisions.
Why Trendlines in Technical Analysis Matter

Trendlines play a crucial role in technical analysis, as they provide traders with a practical and clear view of how prices are moving.
- Act as a Dynamic Support and Resistance
In an uptrend, trendlines act as support; however, in a downtrend, they serve as resistance and evolve as the price changes.
- Identify Market Direction
Trendlines help traders in showing whether the market is going down, up, or sideways, which makes it easier to follow the main trend.
- Reflect the Collective Market Psychology
Trendlines show how sellers or buyers react over time, which outline the crucial level where the market usually reacts.
- Help in Trade Entries, Exit, or Stop-loss Placement
Traders use trendlines to plan better exit or entry points and to place stop-losses just beyond the line to manage the risks properly.
Who This Is For / Not For?

Trendlines are ideal for:
- Swing traders
- Position traders
- Trend-following strategies
Trendlines are less effective for:
- Scalping without confirmation
- Highly volatile news events
- Illiquid stock
Trendlines vs Related Technical Tools
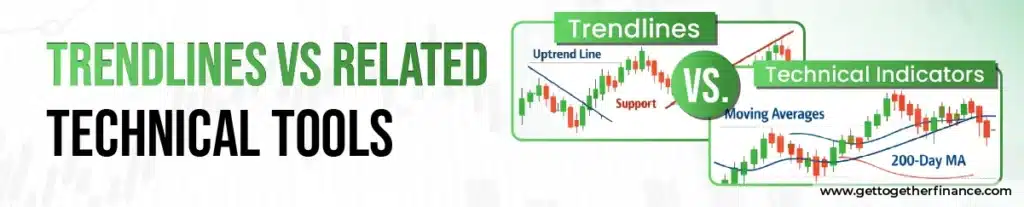
Let’s understand it by the given table below:
| Tool | Purpose | Key Difference |
| Trendline | Identify market directions | Follow price movement to show the trend |
| Moving Averages | Smooth price data | Indicator-based and calculated mathematically |
| Support and Resistance | Identify main price levels | Focuses on horizontal price zones |
| Channel | Define trading range | Uses two parallel lines to indicate lower or upper boundaries |
Key Insights: Breaking a trendline can show a temporary pause or trend reversal in the current trend.
What are Some Rules for Trend Lines and Channels?

- At Least Two Points: A valid trendline requires two points of contact, like higher highs or lower lows, etc. but having three or more concurrent points increases its reliability.
- Slope Consistency: The slope of the trendline should be consistent with sharp angles, indicating a stable and reliable trendline with nearly price support and resistance levels.
- Time Frame: Always go for using trendlines in higher time frames and then align them to lower time frames, higher time frames are more reliable.
- Breakouts: when the price breaks or goes beyond the trendline, it indicates the breakout. This means the trend is not going to reverse, instead, the trend is going to continue.
- Channels: When a parallel line is drawn opposite a trendline, it forms a channel, highlighting both support and resistance levels.
Types of Trendlines
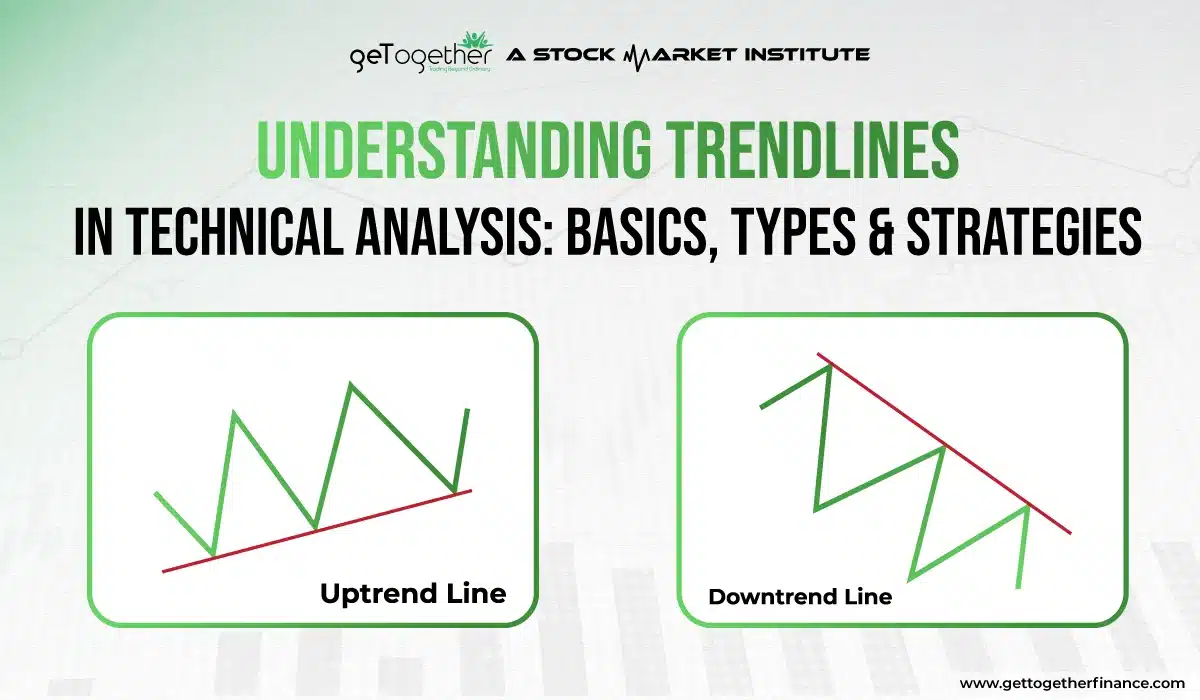
After understanding the basic definition of trendline, it’s time to explore its types. We have two key players in the game – uptrend line and down trend line. Let’s roll more details in this subject:
What is a Uptrend Line:

Imagine this as a way to a mountain top. An uptrend line connects the lows of an asset’s price, showing that it’s climbing over time. It’s a positive slope that requires at least two to three low points to verify the validity of the trend line. In simple terms, if the stock price drops and recovers with rallies multiple times, traders can easily draw the uptrend line via connecting the dots of their lows. Remember – the second low must be higher than the first to show the positive impact.
Note: If the price stays above the trendline, it is considered as uptrend. It acts as support in the demand of stock and shows a bullish attitude in the stock price. Although history is evident of several fake outs, it is essential to ensure before making a confirmed interpretation on the basis of trendlines.
What is a Downtrend Line?

On the other side, a downtrend line is like slanting into a valley. In this, the line connects the highs of an asset’s price, showing a downward trend. If a stock’s price is consistently dropping, merging the high points on the chart creates a downtrend line. Simplifying, if the stock price rallies and drops multiple times while creating consistent high points, traders can detect the downtrend line, drawing those high points.
Important Note: Downtrend line acts as resistance and demonstrates decline in the stock price. It shows a bearish attitude and increasing number of sellers. If the price remains under the line, it means the downtrend is robust. However, a break above the line shows that numbers of sellers are decreasing and change can be reversed.
Reading a Trendline
Reading a trendline is as easy as connecting the dots. When you look at a trendline on a chart, it’s like following a road and it has a story to tell. An uptrend line tells traders that the price of an asset is going up, indicating a bullish trend. Conversely, a downtrend line speaks of drop in price, signaling a bearish trend. Understanding these lines allows you to anticipate future price movements.
How Do You Validate a Trend Line?
Consider them as clues in a detective story. You have to validate your proofs to make sure that you are right on the track and save yourself from the trouble of starting over. It simply means to always check if the price follows the trendline’s path. For example – in an uptrend line, ensure that lows consistently rise. On the other hand, see if the highs are consistently falling in a downtrend. Well! If the price behaves as expected, you’ve got a valid trendline.
Trendlines v/s Channels
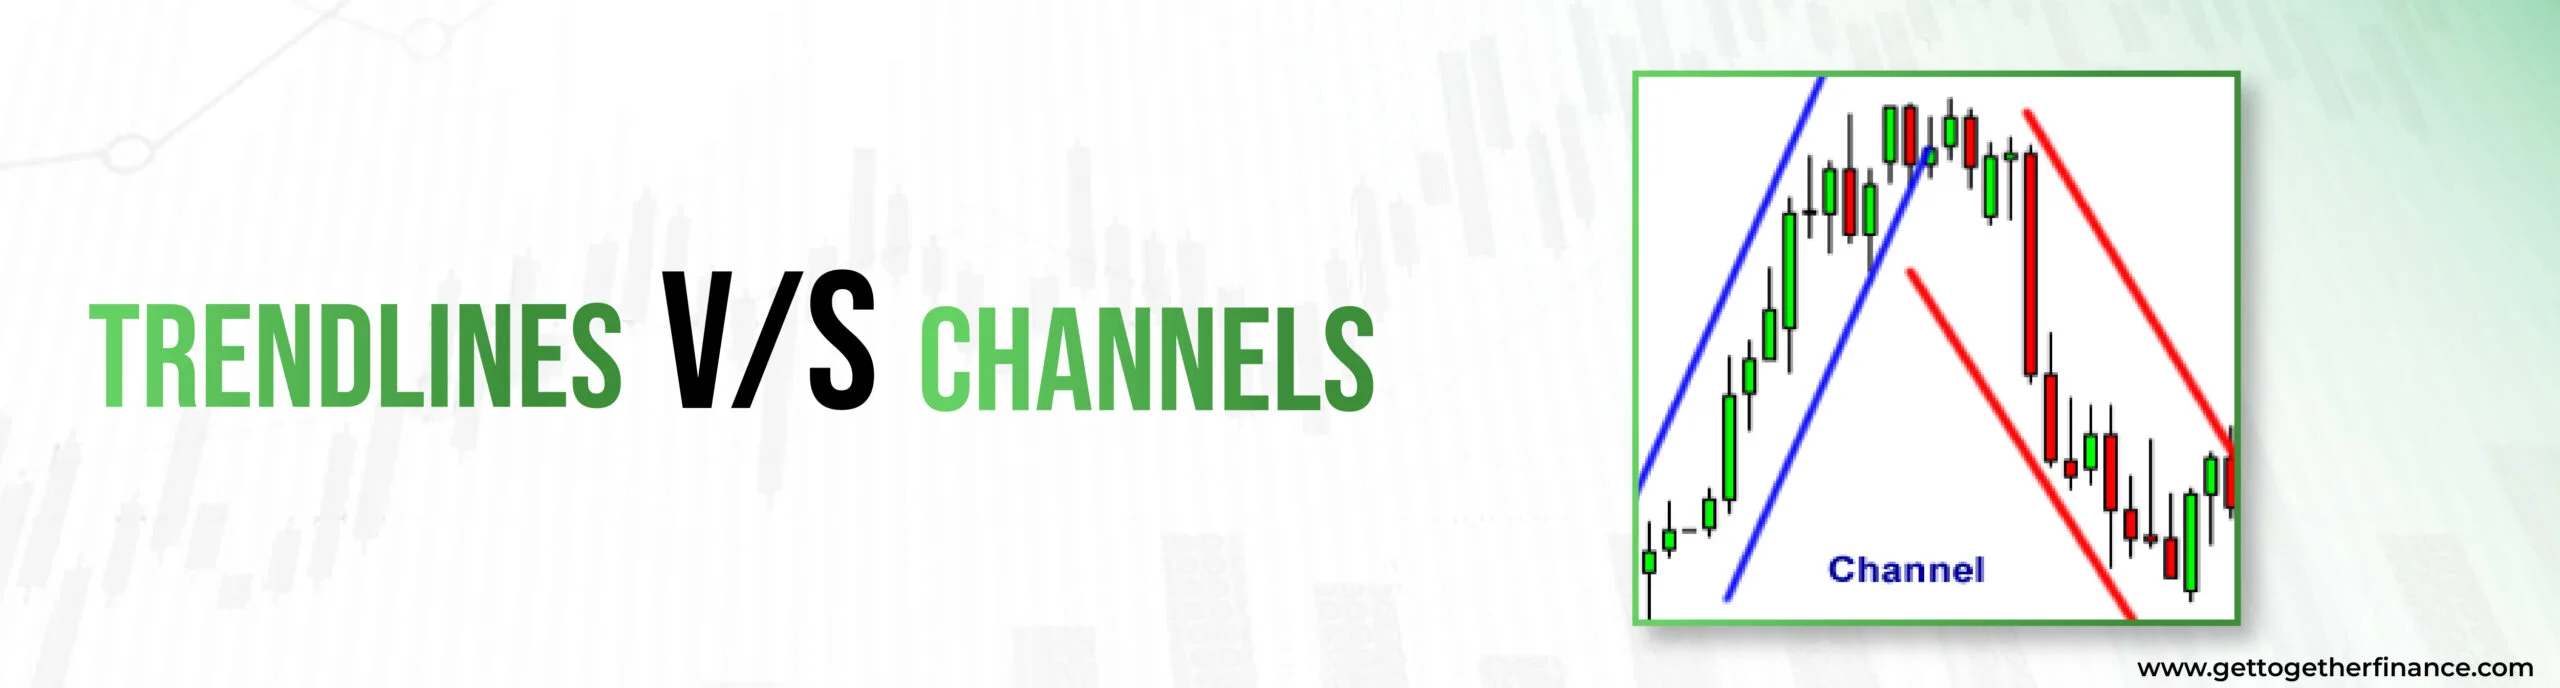
Although both of these terms sound similar, there is a fine line between channels and trendlines. they both are like cousins of. Channels are created by two parallel lines drawn as support and resistance, showcasing a price range. While trendlines are single lines, connecting the dots (price) to represent the trend direction. Let’s dig deep into both concepts:
| Aspect | Trendlines | Channels |
| What are they? | Lines connecting price points to show trends. | Two parallel lines outlining the price range. |
| Usage | Indicate trend direction. | Reveal price range or consolidation. |
| Reading | Single line showing trend. | Two lines create a channel. |
| Interpretation | Price likely follows the line. | Prices typically move between lines. |
| Direction | May be sloping up (uptrend) or down (downtrend). | Prices contained within the channel. |
| Support/Resistance | Potential support or resistance. | Upper line resistance, lower line support. |
Trader Psychology Behind Trendlines

Trendlines in technical analysis work because they indicate how traders think and react to changes in price. They are not just lines on the chart; they show market psychology.
- Sellers repeatedly reject falling Trendlines
In a downtrend, sellers see the falling trendline as a selling zone. When the price reaches this point, sellers come in and reduce it again.
- Breaks happen when Market Sentiment Changes
When a trendline breaks, it indicates a shift in market sentiment. Also, the seller or buyer loses their confidence in the current trend, which leads to market slowdown and reversal.
- Trendlines are not Guarantees
Trendlines in technical analysis indicate expectation based on how prices have changed before, but they cannot forecast what will happen next. Because of this, waiting before confirmation and managing risk is crucial.
- Buyers repeatedly reject increasing Trendlines
In an uptrend, buyers see the increasing trendline as a sign to buy. Each time the price returns to this point, buyers see it as a chance to get in, believing that the price keep increasing.
Key Insights: A trendline becomes stronger when the price touches it various times.
Can Trendlines be Identified Using Scanners?

Yes, trendlines in technical analysis can be identified using scanners. Modern trading platforms such as GTF Eye Scanner, Thinkorswim, TradingView, and MetaTrader have automatic trendline-detecting features that draw trendlines and examine prices for you.
These scanners use an algorithm to spot patterns where price forms lower highs and higher lows that automatically join these points to create trendlines. It saves a lot of time to scan multiple stocks or time frames.
Although scanners have some limitations. They usually draw so many trendlines or create false indications. Also, they don’t understand market context as humans do.
The best way to use scanners is to use them as a starting point to quickly identify potential trends, but also to confirm them manually.
Limitations
As much as we love trendlines, they’re not foolproof. One of the key limitations is that they may not predict the future accurately. Market is highly dynamic and can change in a flash, and trend lines might not always keep up. Moreover, when prices get too volatile, they can become less reliable.
We at GTF believe that, “trend is our friend” but only if you complement it with demand-supply theory (or your own research). You can back up your research with the trendlines, but if you’re completely relying on it – without support research – it can bite you back. History is evident that trend lines can be deceiving and should always be considered following your own findings. Remember, they’re useful tools, but not crystal balls.
When Trendlines Stop Working?
Trendlines are helpful, but they don’t work in every market situation. Here are some conditions where they tend to fail:
1. Lower timeframe without Confirmation
Shorter timeframe has more price fluctuations. If you don’t confirm with a higher indicator or timeframe, the trendline gives a false breakout.
2. Sideways or Range-Bound Market
In a sideways market, the price remains in a tight range instead of going up and down. This makes the trendline less effective.
3. Low-volume Market
Low trading volumes can result in weak price movements, which makes the trendline easier to break.
4. News-driven Price Spikes
Unexpected events, announcements, or news can trigger sharp price movements that ignore trendlines and other technical signals.
5. Poorly selected Swing Points
Using the wrong highs or lows leads to incorrect analysis and false signals.
Fakeout Breakouts : The Caution
Like a prank, it occurs when the asset price rises above breaking all the resistance levels, but for temporarily. This creates a perfect illusion of a significant breakout, but then it quickly recovers and reverses below that level. It’s akin to thinking you’ve struck gold, only to find fool’s gold instead.
Note: Almost every trendline on the chart shows the signs of fake breakouts. To avoid such situations, ensure to connect as many high or low points as possible or apply other indicators such as Demand-Supply, or RSI.
Trendline Best Practices (Quick Checklist)

Use this checklist to make your checklist more practical:
- Use at least two confirmed Swing Points
Always make sure that the highs or lows you connect are clearly visible and important.
- Avoid forcing Trendlines to fit the price
If a trendline doesn’t fit naturally, it is better to redraw rather than forcing.
- Confirm with the Indicators or Volume
You can confirm trendline indications by using tools like moving averages, RSI, or volume.
- Prioritize higher Timeframes
Trendlines on higher timeframes are generally more reliable and stronger.
- Adjust Trendlines as Structure evolves
Market changes, so update your trendline when required.
It’s A Wrap
Trendlines are the roadmap to understanding market trends, which come in two main flavors: uptrend and downtrend lines. These lines help you spot bullish and bearish trends. Just keep in mind that, while trendlines are handy, they aren’t magic. They provide valuable information, but you should always consider it as your back-up data to support your primary theory. GTF traders use trendlines to add more accuracy in their demand-supply theory.
FAQs
What are trendlines used for in trading?
It help traders identify the direction of an asset’s price movement, whether it’s going up (uptrend) or down (downtrend). Trendiness is like your trusty guides which help us figure out the direction of price movement. One can use it to spot potential buy or sell points, or to detect resistance and support levels. But remember to depend on it completely
Can trendlines predict the future?
Not really! While trendlines are helpful, there is no tool or person who can guarantee future price movements. Market conditions can change unexpectedly, and it is not wise to rely on one specific tool, insider tip, or technique completely. Hence, as expert traders say, trends can be your friend but keep your own research as your first priority.
Are there other tools to use with trendlines?
Absolutely! Traders often use other technical analysis tools and indicators in combination with trendlines to make well-informed trading decisions. There is a list of tools you can use along with it to validate your research, including moving averages, support and resistance, Relative Strength Index (RSI), candlestick patterns, volume analysis, chart patterns, Fibonacci Retracement, and demand and supply theory.
Why are trend lines significant in technical analysis?
They are a big deal in technical analysis. They help us see where prices are headed, acting as support or resistance, and let us know when to buy or sell. They’re like our secret weapon for making smart trading decisions and staying ahead in the market game. So, yeah, you can say, trendlines are pretty significant. But it is recommended by expert traders to use trendlines as a back-up to validate your own finding and not rely on it completely.
What should a trader do when a trendline breaks?
When a trend line breaks, traders should watch out for a potential trend reversal. If the trend line that was acting as support is broken, it may indicate a shift from an uptrend to a downtrend. Reversely, if the trend line which was acting as resistance breaks the pattern, it could indicate a change from a downtrend to an uptrend. Traders should be cautious, use other indicators, and consider their trading strategy accordingly.
How to use a trendline to identify the direction of a trend?
It is very simple to identify a trend using them. Here is the process you can use for simplifying the process:
Draw the Line: You can start by drawing a trendline on the price chart.
Analyze the Slope: Later check the direction of the line’s slope.
1.Upward slope indicates an uptrend.
2.Downward slope suggests a downtrend.
Price Behavior: Next, closely observe how prices interact with the trendline.
1.In an uptrend, prices stay above the trendline, using it as support.
2.In a downtrend, prices remain below the trendline, treating it as resistance.
Confirmation: Lastly look for multiple touchpoints where prices respect the trendline to confirm the trend direction.
Remember to use trendlines alongside other technical indicators and your trading strategy for a more comprehensive analysis.
How does the angle of a trend line affect its validity?
The angle of a trendline makes a real difference, but remember exceptions are always there. If the line is almost straight up, just like a super steep mountain – it seems intense but might not last. Contrary, if it’s almost flat like a barely sloping mountain – the trendline in such cases is considered weak and indication of sideways movement. As per experts, the best trendiness is somewhere in the middle, like a sweet, manageable slope. It’s where the seat spot of a trend is hidden, ready to keep going.


