The Power of Trend Analysis – From Data Insights to Impact
- Updated on : May 23, 2026
- 3445 Views
- by Arun Singh Tanwar

 Facebook
 Instagram
 Youtube

Overview
German philosopher Karl Marx once famously quoted, “history repeats itself”. Just like the World Cup winnings of India, Influenza & Covid pandemic, and many other events. But fortunately, we also have proof suggesting that you can’t predict the future based on past events. Life has twists and turns that even history can’t always predict. Right?
But what if you hear the weather forecast of rain, would you still not carry an umbrella to work, just in case? If yes, then this is what trend analysis is all about. Like fundamental and technical analysis, reading trends is also a super cool technique, grounded on fantastic ideas of facts and statics study. Don’t worry, it’s not as tricky as it sounds. Imagine we’re on a treasure hunt to find out where things are going – let’s roll deeper into the concept!
What is Trend
A trend is like noticing a pattern or direction that something is moving in. It’s like when you see more and more people wearing pink clothes – you can tell, ‘Hey, that’s the “Barbie” movie trend’.
In the stock market, it’s about looking at how the prices of stocks are going over time. If the line goes up, up, up – that’s an “up” trend! If it goes down, down, down – that’s a “down” trend.
These trends give us internal insights and possible market prediction of where things are going to make smarter choices. Just like seeing lots of people wear the same color, trends show us where things are headed in the financial world.
What is Trend Analysis
Trend analysis is like checking the weather forecast before you leave home. It’s not about predicting the future, but about being prepared based on past patterns. It’s an extra tool that helps traders understand where things might be headed. Trend analysis looks at historical data, like prices and trading amounts, to guess where the market’s heading. It checks short, medium, and long timeframes. Just like preparing for rain, trend analysis helps us be ready for the financial “weather.” In brief;
- Trend analysis predicts trends, like whether a bull market will keep going or change to a bear market.
- It looks at the past to guess what might happen next – like using history to tell the future.
The Trend analysis follows a trend until the trend is completely reversed. The length of trend direction determines the accuracy of a trend.
Note: Even though trend analysis uses lots of data, it doesn’t always guarantee the predictions will be right.
Types of Trends
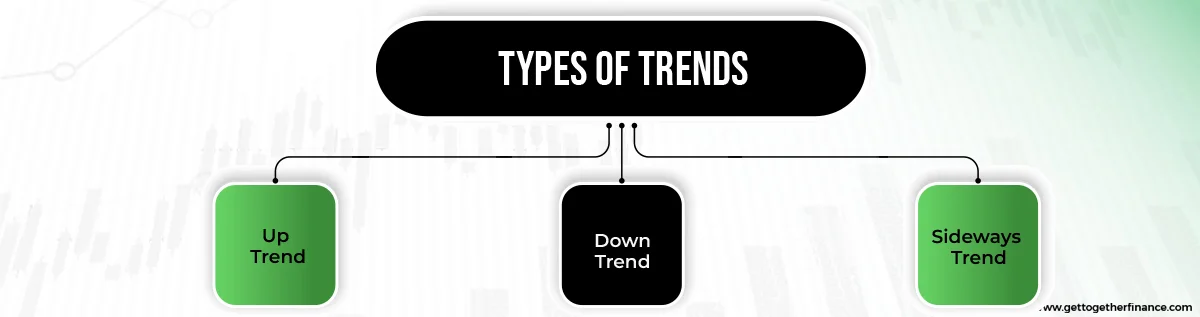
Just like every other analysis pattern, there are three basic types of trend analysis. Let’s go into the depths without wasting a jiffy.
- Up Trend: This is like a bull market, numbers are going up like a rocket to the sky. Just like when your balloon floats up high!. It’s a sign of a strong economy, often driven by high demand, growing profits, and good economic conditions.
- Down Trend: Imagine a bear market. It’s when prices keep going down for a while. This signals a weaker economy, caused by low demand, dropping profits, and not-so-great economic conditions.
- Sideways Trend: Known as rangebound market, in a sideways trend, prices stay stable in a certain range. It’s like they’re not sure where to go. This happens when there’s not a clear direction, and prices go up and down in a narrow range.
How to Perform a Trend Analysis
magine you’re looking at a roller coaster – you want to see if it’s going up or down, right? Trend Analysis is like looking at a graph with lines. If the lines go up, it’s a happy trend. If they go down, it’s a not-so-happy trend. So, let’s play detective! We grab our magnifying glass and look at the numbers over time. Are they going up, down, or chilling? Let’s find out:
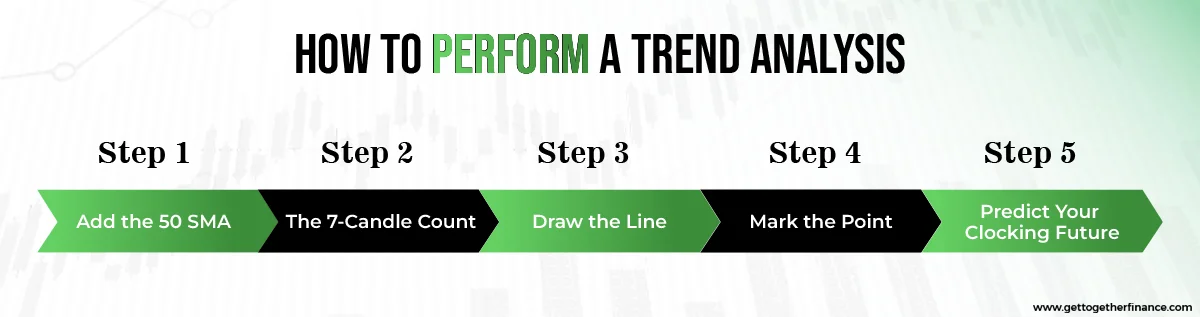
Step 1 – Add the 50 SMA: Decide which part of the market you want to check out, including industry or investment like bonds. Put the 50 Simple Moving Average (SMA) on your price chart. It’s like drawing a line on a map.
Step 2 – The 7-Candle Count: The 7-Candle count is an expert’s way to begin trend analysis. Just count 7 candles backward from the one you’re looking at. It’s like going back in time a little.
Step 3 – Draw the Line: When you reach that seventh candle, draw a vertical line. Think of it as putting a big mark on your timeline, like marking an important spot on your timeline.
Step 4 – Mark the Point: Where your vertical line touches the 50 SMA, draw a horizontal line. It’s a bit like connecting the dots on a picture.
Step 5 – Predict Your Clocking Future: Now, picture a clock in your mind, just like the one on the wall with numbers 12, 3, and 6. Take a look at the time to guess ahead. Here the Rule Book which experts use this info to guess market direction;
- Trend Up: If your moving average is between 12 and 3 on your imaginary clock, and it’s green, that means the trend is going up. It’s like a green light for traders.
- Trend Down: When your moving average falls between 3 and 5 on the clock, and it’s red, it signals a downward trend. It’s like a red light, warning of a possible decline.
- Trend Sideways: If your moving average is close to 3 on the clock, and it could be either red or green, that suggests a sideways trend. It’s like a yellow light, indicating caution because things aren’t moving strongly in any direction.
There you have it, your trend analysis!
This method helps traders predict certain market movements using the 50 SMA and a bit of time-travel-like analysis.
Caution/Important Note: Buying when the stock is going down and selling when it’s going up can be really risky. “Trend is your friend” only when you use it to support your demand-supply calculations, but remember to not rely on it entirely.
Also Read: Moving Averages
Trend Trading Strategies
Trading using trend analysis techniques is like playing catch. You have to catch the ball that keeps coming at you. Exactly the same way, you read the trend and make a purchase decision to make more strategic decisions using different technical indicators such as MACD (Moving Average Convergence/Divergence) etc.
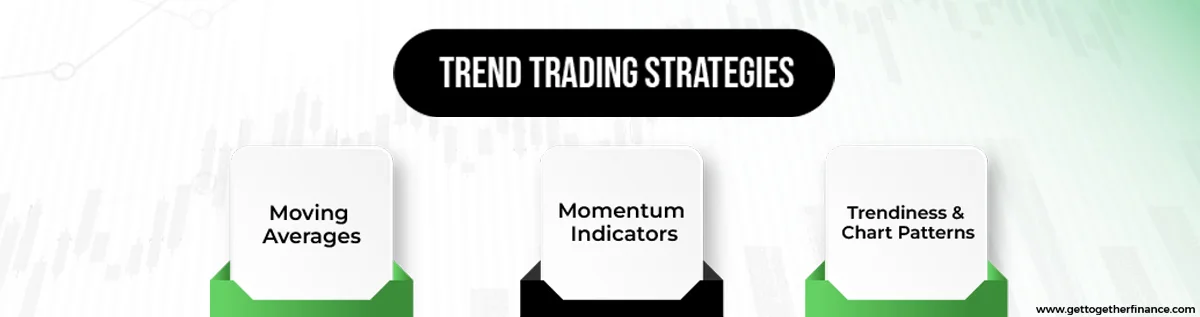
- Moving Averages: The strategy uses an average of past prices to show where the trend might go next. Like how looking at your past tests can tell you how you might do in the future
- Momentum Indicators: These are like checking the speed of a car. They see how fast the price is changing and if it might keep going that way or slow down. Most commonly RSI (Relative Strength Index) is used for this.
- Trendiness & Chart Patterns: Think of this like looking at a pattern in your friend’s drawings. Traders see patterns in price charts that tell them if the trend is strong or if it might change. It’s like predicting what shape your friend will draw next!
Important Note: Trend following is like riding the wave in trading. Experts often use computer analysis, market momentum, and modeling of relevant data to predict trends.
What are Indicators – How is it Useful?
Think of indicators like special tools for stock traders. They make things easier by showing when to buy or sell stocks. It’s a bit like having a weather forecast for the stock market!
Imagine indicators as traffic signs that help traders navigate. They check the market vibes and predict where it might go next. Traders can use these signs for different timeframes and adjust them as they like. Experts even mix different signs to make better decisions. These indicators can be used for more than one purpose, all you need to do is – find a suitable indicator, conduct in-depth research, and especially test it before using on live orders.
But here’s the thing: before you start using a sign for real trading, try it out first. It’s like trying on new shoes to see if they fit. Indicators can be your cool sidekick on your stock market adventure!
Extra Tip (Wink – Wink): Our trading and stock market experts really love this one indicator – the supply-demand detector – GTF Indicator. It’s like their favorite tool in their trading toolbox. This indicator is like a detective that sniffs out the clues hidden in the market. It helps them figure out where the buyers and sellers are hanging out.
Also Read : Types of stock market indicators
Pros & Cons of Trend Analysis
Trend analysis is like a superhero power for traders, but even superheroes have their strengths and weaknesses. The cool thing is, it helps us make smart guesses about the future. Let’s break down the advantages and disadvantages about trend analysis in the stock market:
Pros:
- Add Strength in Numbers: Think of trend analysis as the best friend of demand-supply zones. When you buy from a demand zone with a friendly trend, it gives that zone a boost and makes your trade more accurate and vice versa with the supply zones.
- Predict the Future: Trend analysis gives you a peek into the crystal ball of the market. It helps you catch trends early, so you can jump on the bandwagon and ride the wave of profits.
- Simple Clues: Trends show you where the crowd is leaning. If more people are buying, you know it’s a good sign. If they’re selling, it might be time to be cautious.
- Cool Indicators: You get to use fancy tools like moving averages and momentum indicators. These are like special glasses that let you see hidden patterns in the market.
Cons:
- Not Always Right: Remember, even crystal balls have cloudy days. Trend analysis doesn’t guarantee that the future will match the past. Trends can change suddenly, leaving you scratching your head.
- Missing the Action: Sometimes trends take a while to show up. By the time you notice, you might have missed the best parts of the party.
- Too Many Cooks: Everyone’s looking at the same trends. If everyone starts buying or selling at the same time, it can create a chaotic market that doesn’t always make sense.
| Advantages | Disadvantage |
| Seeing future trends | Not always accurate |
| Add more accuracy in demand-supply zones | Misinterpreted if read alone |
| Reviewed clues on buying/selling | Missing opportunities |
| Use of cool indicators | Diverse statistical outcomes |
So, trend analysis is like a trusty sidekick, helping you navigate the stock market. But just like any superhero team, it’s important to know when to rely on it and when to be a bit cautious. If you’re using the trend analysis – use SMA 50, SMA 20, or EMA 50 indicators for more accurate review of the data.
What is the Formula or Model for Trend Analysis
There isn’t a secret code, but trade experts use math and charts to understand trends. It helps draw lines that assist in seeing where things are going. It’s like making a map to find a hidden treasure. But here are all the narrowed down few patterns or trends for you:
Linear Regression:
Think about how your toy car moves on a straight road. If you know how far it goes for every second, you can draw a line to show its path. Used to identify the international between two variables, this often shows the strength and direction of a trend. Linear regression is like drawing this line. It helps you understand how two things are connected. For example, if you eat more ice cream, your smile might get bigger. Linear regression checks if this is true and how strong the connection is.
Moving Averages:
Imagine you’re at a noisy playground. Sometimes, there’s a lot of noise, and other times it’s quiet. A moving average is like using your ears to hear a softer, steady sound. It is a statistical measure that uses simple moving average (SMA) technique to clear up fluctuations in data with time. You gather the noise levels over a little time, like the last few days or weeks, and find the average. This helps you spot if there’s a trend in the noise, like if it’s generally getting louder or quieter. Often used for short-term fluctuations in data and noticing longer-term chart patterns.
Correlation:
You know how sometimes your friends’ actions match yours? Like if you jump, they jump too? That’s kind of like correlation. As the name states itself, correlation helps statistically measure the direction and strength relationship between two different variables. It checks if two things happen together often. If they both go up or down, it’s a positive correlation. If one goes up and the other down, it’s a negative correlation. This helps us find out if there’s a pattern between things, like if sunny days make you happier.
Writer’s Tip: SMA 50 or Simple Moving Average 50 is one of the most interesting indicators that helps calculate the average of a stock’s price over the last 50 days. It’s like a friendly helper, showing the middle price and telling you if prices are going high or low!
These are like tools grown-ups use to understand how things change and relate to each other. Pretty cool, huh? Speaking of tools, “Advanced Trend Analysis” is one of the most efficient and reliable methods, based on demand and supply dynamics. It’s quite the mouthful, but it’s a pretty nifty way to figure out how things are gonna go down.
How to Prepare for Trend Analysis
Be ready for more smart stuff! You’ll need a notebook to write down numbers and a ruler to draw lines. It’s like getting your explorer gear for an exciting adventure. Here are few steps to prepare for the trend analysis:
- Choose What to Watch: First, decide what you’re looking at – it could be a specific thing like a stock, money stuff, or even the general market vibes.
- Select Timeframe: Think about how long you want to look at. If it’s a whole year, maybe check once a month. You can select a timeframe and use your marker with those trends.
- Picking the Right Info: Depending on the time you picked and what you’re checking, grab the exact info you need. Imagine it’s like picking the right toppings for your pizza.
- Gather Up Data: Once you’ve got your info, put it all together like puzzle pieces. Get rid of the stuff you don’t need, so you can see the cool trends.
- Get Graphing: Use some cool tools to turn your numbers into a picture – like drawing a doodle. This picture helps you understand what’s happening with your info.
- See the Trend: Look at your picture (graph) and see if it tells you a story. If it goes up or down a lot, that’s a trend.
- Smart Moves: Based on the story your picture tells, you can make clever choices. It’s like using a treasure map to find the best spots for your money.
Remember, this is like being a detective for numbers and making wise choices based on what you find. So, gather your info, grab your tools, and get ready to spot those trends!
What Does the Critics Say

Nothing is perfect and criticism of a concept is crucial to see both sides of a coin. Critics of trend analysis and technical trading say that markets are efficient and already consider all info. They think history might not repeat and the past doesn’t predict the future. Some prefer analyzing companies’ finances to predict prices. They believe stock moves are random, not patterns. Let’s get into some details:
Efficiency Debate
Some smart folks say markets are super efficient – that means they already know everything there is to know. So, they argue that history might speak the exact same words, and what happened before might not happen again. They believe in using financial reports and economic models to predict prices, saying that daily stock moves are like random walks.
Efficient Market Hypothesis
Ever heard of the “Efficient Market Hypothesis”? It’s like this theory saying it’s tough to beat the market because all the prices already include everything known. In simpler words, it’s like finding a hidden treasure without a map. Some folks say if everyone believed it, markets wouldn’t work!
Interesting Fact: In 1973, Burton Malkiel wrote ‘A Random Walk Down Wall Street.’ He believed stock prices move randomly and can’t be trusted to follow a trend. This suggests past prices can’t predict where stocks are going. Even though traders see trends, some still support these ideas, despite prices not always being random.
Patterns vs. Randomness
There are three versions of this Hypothesis – weak, semi-strong, and strong. But hey, traders say this doesn’t mean we can’t predict. They’ve got techniques like technical analysis. A famous book even said stocks dance randomly, but traders disagree. They see patterns, not chaos.
Is Technical Analysis Just gibberish?
Some skeptics call technical analysis “pseudoscience,” saying it’s a waste of time. They think past patterns can’t predict future moves. They say humans are unpredictable, and so are markets! But traders know charts aren’t crystal balls.
Self-Fulfilling or Fun-Fueled?
Some say charts are self-fulfilling – if traders believe a pattern, they make it real. Like a happy dance that turns into a real party! But traders say, “So what?” If it works, it works. Whether it’s math or magic, it helps them trade smart.
Writer’s Take
Believe or no believe, study or no study, trend or no trend, the point of everything is to not blindly walk on a road but make your own decision when the right time comes. Just remember, trends can be like a puzzle – but not relying completely on it is something our experts highly suggest. Keep exploring, little detectives, and have fun predicting the future of numbers!
FAQs
Q1: How do you know if a stock market trend is valid?
A: Checking if a stock market trend is legit involves looking at its consistency over time. If a stock keeps going up or down for a good while, that’s a sign. But remember, trends can change, so don’t bet the farm on just one trend!
Q2: How do you analyze a stock?
A: Easy peasy! When you analyze a stock, you’re basically digging into its details. Check out the company’s financial health, how it’s doing in its industry, and any news that might affect it. Think of it like investigating before buying a cool gadget. However, trading experts use various techniques – like fundamental analysis, technical analysis, or trend analysis to go in-depth of stock review before investing.
Q3: Can technical analysis help identify long-term stock trends?
A: Yep, it can lend a hand! Technical analysis involves studying charts and patterns to predict where a stock might go. But keep in mind, while it’s good for short-term hints, long-term trends can be trickier. Mixing in other info is a smart move.
Imagine you’re looking at a puzzle made of numbers and lines. This puzzle helps us understand how the price of something, like a toy or a game, changes over a really long time. We look for patterns in this puzzle. If we see the same kind of pattern happening again and again, it can tell us if the price might go up or down for a long time. It’s like noticing if the weather gets colder every winter – we can guess it might happen again next year. Technical analysis is like using these patterns to make smart guesses about the future of prices.
Q4: What are some examples of technical indicators in technical analysis?
A: Oh, good question! Technical indicators are like tools in a stock detective’s kit. Technical indicators are like exclusive tools that help us understand how price might affect or change. Let’s discuss some examples:
Moving Averages: It’s like finding the average of prices over a certain time. If it’s going up, prices might go up too!
RSI (Relative Strength Index): The indicator helps us know if something is too popular or not popular enough. If it’s too popular, the price might go down soon.
MACD (Moving Average Convergence Divergence): It’s like checking if two lies are getting closer or farther apart. This can show if prices will change direction.
Bollinger Bands: Think of it like putting a rubber band boundaries around prices. If they go outside the band, they might come back inside soon.
Stochastic Oscillator: It helps us figure if prices are going really high or really low. If they’re too high, they might come down later.


