Breakout Trading: Overview, Types, and Example
- Updated on : January 23, 2026
- 2183 Views
- by Manaswi Agarwal

 Instagram
In the market of financial securities, there are vast numbers of opportunities for traders in predicting breakouts at the correct time and can offer great returns. Breakout trades are quite difficult to predict which requires trading experience with accuracy. To learn how to do breakout trading and how to predict breakouts in the security for profitable returns, delve deep into this blog.
What is Breakout Trading?

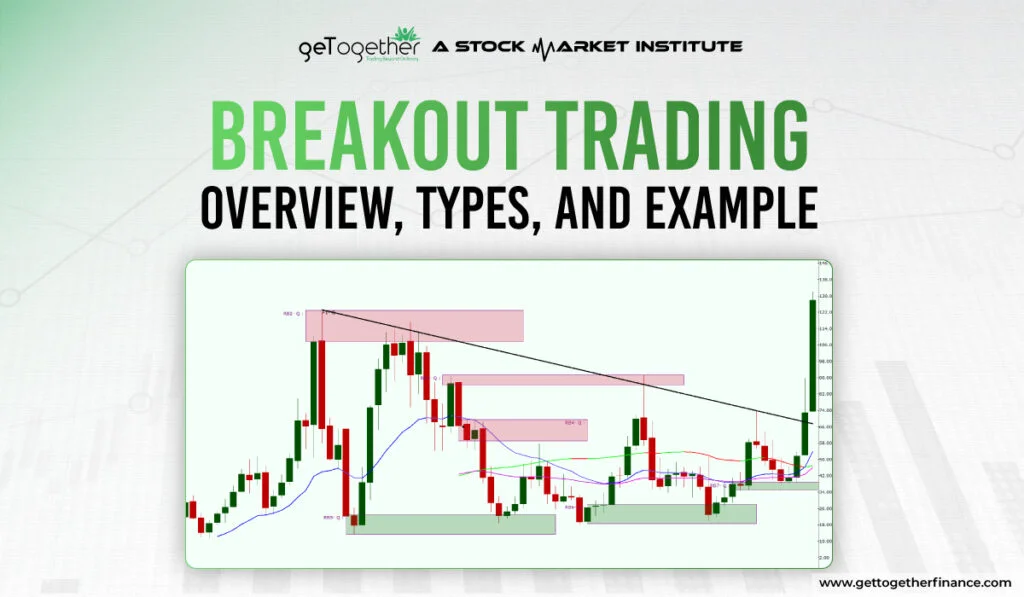
Breakout trading is a specific trading strategy which aims to buy or sell the financial securities when they break defined price levels in the charts. A breakout trader adopts this strategy by researching potential securities that broke through significant support or resistance levels with a surge in volume.
Breakout traders mostly track the consolidation period where the prices of a security roam around a tight range, suggesting a balanced stage of buyers and sellers. Typically, a trader waits for the prices to break this range with increased volume and go with the trend.
Breakout vs. Breakdown: What’s the Difference?

A breakout and a breakdown are two core movements every trader must understand before applying any breakout trading strategy.
If you’re wondering what a breakout in trading is, the answer becomes clearer once you compare it to a breakdown. A breakout occurs when the price moves above a major resistance level, while a breakdown happens when the price falls below a significant support level.
Both movements represent a critical shift in market sentiment and can be observed across any breakout in the share market or breakout in the stock market setup.
| Movement | Key Market Signal | Trading Implication |
| Breakout | Buyers overpower sellers $\to$ bullish momentum begins | Signals potential long trades |
| Breakdown | Sellers overpower buyers $\to$ bearish momentum starts | Signals potential short trades or exit levels |
Breakouts typically follow a tight consolidation phase, signalling that buyers are actively preparing for a strong upward move. Breakdowns indicate the opposite—sellers taking firm control and initiating a strong downward trend. Understanding this difference is essential because traders often confuse the two, leading to wrong positions and potential losses. A breakout is the foundation of every breakout trading strategy, while a breakdown helps identify bearish opportunities and prevent losses.
Which Chart Patterns Are Best for Breakout Trading?

Here are the most effective and widely used breakout chart patterns for capitalising on a breakout in the stock market:
- Triangle Patterns (Ascending, Descending & Symmetrical)
Triangle patterns are among the most reliable formation structures in the breakout in the stock market. They naturally build pressure within a narrowing range, which later results in a strong breakout or breakdown.- Ascending triangle: bullish breakout potential.
- Descending triangle: bearish breakdown potential.
- Symmetrical triangle: breakout in either direction, depending on volume confirmation.
- Head and Shoulders / Inverse H&S
These are classic reversal patterns that indicate a major trend change. A profitable breakout occurs once the neckline is breached with a surge in volume.
- Flag and Pennant Patterns
These patterns occur after a sharp initial move, followed by a short period of consolidation. They signal trend continuation and are very powerful for capturing quick moves, especially in intraday trading.
- Rectangle Pattern (Range Breakout)
When price moves within a horizontal range for multiple candles, the eventual breakout from this range usually leads to a strong directional move.
The cleaner and more well-formed the structure, the more reliable the breakout trading strategy becomes.
Types of Breakout Patterns

Breakout traders identify the patterns or areas from where the prices break a significant level while providing profitable trading opportunities in the financial market. Some commonly traded breakout patterns include:
Horizontal Breakouts
A horizontal breakout level occurs when the price forms a horizontal pattern like a rectangle as it ranges between the same levels for a certain period of time. Traders identify the stock trading in a narrow range since a long time and hence pick profitable opportunities at the breakout levels.
Trend Line Breakouts
Suppose a stock trades in uptrend making higher highs and higher lows within the trend line, when the price breaks the trend line indicating a potential downwards reversal, breakout traders make their position downwards to make certain profits.
Triangle Breakouts
You must be quite aware about triangle patterns which are classified as ascending, descending, or symmetrical triangle patterns. In a triangle pattern, a breakout occurs when the price breaks the support or the resistance level.
Head and Shoulders Pattern
Head and Shoulders pattern is recognized by the three peaks, middle one being the highest representing the head of the pattern while the side ones being the shoulder of the pattern. The pattern gives a profitable breakout when prices tend to break through the neckline of the pattern with a surge in the volume.
Flag and Pennants Breakout
Breakout trades are initiated when the price breaks out of the flag or the pennant pattern which is marked by an extended period of consolidation that is followed by a breakout in the continued trend.
How to Identify Breakouts?

To find breakouts in financial assets, an individual requires a great trading experience as it comes with analyzing securities on a regular basis. However, potential technical indicators help you to analyze the market and the assets guiding you about the breakout direction.
- Watch out for the stocks that are following a critical level and are about to give the closing, breaking those levels either downwards or upwards.
- Place you stop loss at the levels in the opposite level of the range to manage the risks and avoid further losses.
- Use technical indicators and trading chart patterns to support your trading strategy such as Moving Averages, Relative Strength Index and MACD and measure the strength of breakout.
- Volume is an important factor to rely on breakout trades as increase in volume gives the required movement in the prices.
- To give a good breakout, a longer consolidation period is preferred.
What Makes a Breakout Trade Valid?

Not all breakouts are reliable. Some can be traps due to low volume or market manipulation. A valid breakout generally includes a few important conditions.
- High Volume
When a breakout happens with a rise in volume, it indicates genuine buying or selling interest.
- Candle Close Beyond the Level
A breakout is considered more reliable when the candle closes clearly above resistance or below support.
- Tight and Longer Consolidation
If the price consolidates for a long time in a narrow range, the breakout is usually stronger.
- Retest of Levels
Sometimes the price comes back to test the breakout zone. A successful retest confirms that the level is respected by the market.
- Trend Alignment
Breakouts that support the higher timeframe trend are generally more accurate.
If a trader follows these points, they can apply a more structured and dependable breakout trading strategy.
What Is the Best Timeframe for Breakout Trading?

Different traders follow different timeframes while trading breakouts. The choice of timeframe depends on trading style and risk appetite.
- For Intraday Traders: 5-minute, 15-minute, or 30-minute charts help identify quick breakout opportunities.
- For Swing Traders: 1-hour and 4-hour charts offer clearer and stronger breakout levels.
- For Positional Traders: Daily and weekly timeframes give highly reliable breakout signals.
Higher timeframes reduce noise and false signals, making the breakout more accurate. Many traders also use multi-timeframe analysis, identifying the breakout zone on a higher timeframe and entering the trade on a lower timeframe. This approach improves accuracy and helps traders find breakout stocks more effectively.
Breakout Trading with Demand and Supply Approach
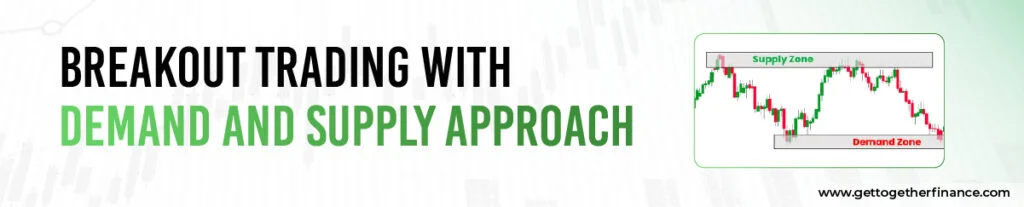
Breakout trading can help traders to gain quick profits, however certain limitations are always associated with trading for which demand and supply theory proves to be more reliable compared to other technical indicators.
To trade breakout patterns, look for the demand zones at higher time frames from which the prices have moved upwards with sufficient consolidation period. If the price continues to follow the formation of new demand zones, it signifies a great buying pressure in the security. A breakout in the security is confirmed after the consolidation period with a sudden surge in the volume when the prices are pushed by demand zones. This consolidation period mainly aims to finish the selling pressure of the security as the price tests the above levels each time.
At the end, the formation of doji candles determine the fight among buyers and sellers which signal the potential breakout in the security and hence diminishing the sellers.
The formation of continuous or reversal chart patterns for breakout trading is an additional advantage in demand and supply approach. And hence, the efficiency and reliability of the breakout increases potentially. To learn these advanced concepts in detail, you can watch the full Trading in the Zone course on YouTube for free.
Advantages of Breakout Trading

Analyzing breakouts at support and resistance levels allows traders to make quick profits without blocking their funds for a longer time frame.
Breakout patterns in the stocks can be observed across different time frames, therefore; it allows positional traders, intraday traders as well as swing traders and investors to pick profitable opportunities.
Breakout patterns determine sudden reaction in the security, if the reaction gets delayed due to any factor, traders get exit signals which offer time efficiency.
Why Do Breakouts Fail, and How Can You Avoid False Signals?

Breakouts sometimes fail due to increased volatility or sudden changes in market behavior. Understanding the reasons helps traders protect themselves from false signals.
- Low Volume: Breakouts without volume often lack strength and reverse quickly.
- Trap Moves: Big players sometimes push the price beyond levels to hit stop-losses and then reverse the move.
- News and Market Events: Breakouts during major news announcements are generally unreliable.
- Short Consolidation: If the price consolidates for a short time, the breakout does not carry enough momentum.
- Against the Trend: Breakouts that move against the major trend often fail.
To avoid false signals, traders should wait for volume confirmation, avoid trading during major news, prefer trend-based breakouts, and consider using demand and supply levels for additional confirmation. This disciplined approach improves the reliability of a breakout trading strategy.
Limitations of Breakout Trading

Breakout trading is one interesting form of trader and a trader can earn quick profits through breakout trades. However, this is not always the case, there are some important considerations which an investor must be aware of to protect the profits and generate profitable returns consistently. Let us know what can limit the breakout trades:
False Breakouts
False breakouts are very common in the financial market because of increased manipulation which is a big disadvantage to breakout trading. A security forms the breakout pattern followed by a consolidation period but ends up retracing back into the previous trading range which leads traders to bear potential losses.
Market Volatility
Market is always uncertain, sudden movements in financial markets can never be ignored which makes breakout trading to be highly challenging. A sudden price movement may trigger the stop losses and result in losses for breakout traders.
Entry and Exit Points
It is quite difficult to analyze the potential level of the breakout as it is quick and volatile, traders cannot capture the whole move as there are no defined entry or exit points. In some cases that might lead to certain losses.
How Do You Set Entry, Stop-Loss, and Target in Breakout Trades?

Whether you’re trading a breakout in the share market or a breakout in the stock
market, the success of the trade heavily depends on your entry, SL, and target placement.
Here’s how to structure them effectively:
1. Entry Method
Enter when:
- A candle closes strongly above resistance or below support
- Volume supports the breakout
- After a retest of the breakout zone (a safer entry)
Retests often give better risk-to-reward ratios and reduce false breakout risk.
2. Stop-Loss Placement
Your stop-loss should be placed at:
- Just below the breakout level (in case of a bullish breakout)
- Just above the breakdown level (in case of bearish breakout.
- This prevents minor pullbacks from hitting your SL.
3. Setting Targets
Targets can be identified using:
- Previous swing highs/lows
- Fibonacci extensions
- Next supply or demand zones
- Measured move theory
- Risk-to-reward minimum of 1:2
Following these systematic exit rules makes your breakout trading strategy more predictable and consistent over time.
The Bottom Line
Breakout trading strategy in technical analysis is one interesting strategy that has the potential to offer maximum returns within a limited time period. On the other hand, looking at the limitations of breakout trading strategies, traders must be very cautious with their risk management. Demand and Supply theory guides them the best to achieve accuracy and reliability which can be learned from Trading in the zone course offered by GTF which is an advanced technical analysis course.
FAQs
What is Breakout Trading?
Breakout trading is a trading strategy where the traders identify the securities that follow a consolidation phase for an extended period and are about to break the range.
What is a Breakout Trader?
A breakout trader finds the securities that are about to break the range by giving profits either in upwards or downwards direction.
How to identify breakouts in securities?
To identify breakouts in securities, follow the demand and supply approach with other technical chart patterns and indicators to receive confirmation.
What are the breakout chart patterns?
Breakout chart patterns include horizontal breakouts, trend line breakouts, triangle, head and should and flag & pennant pattern.
Which is the most reliable breakout trading method?
One of the most reliable breakout trading method is identified through demand and supply zones once the confirmation is received.


