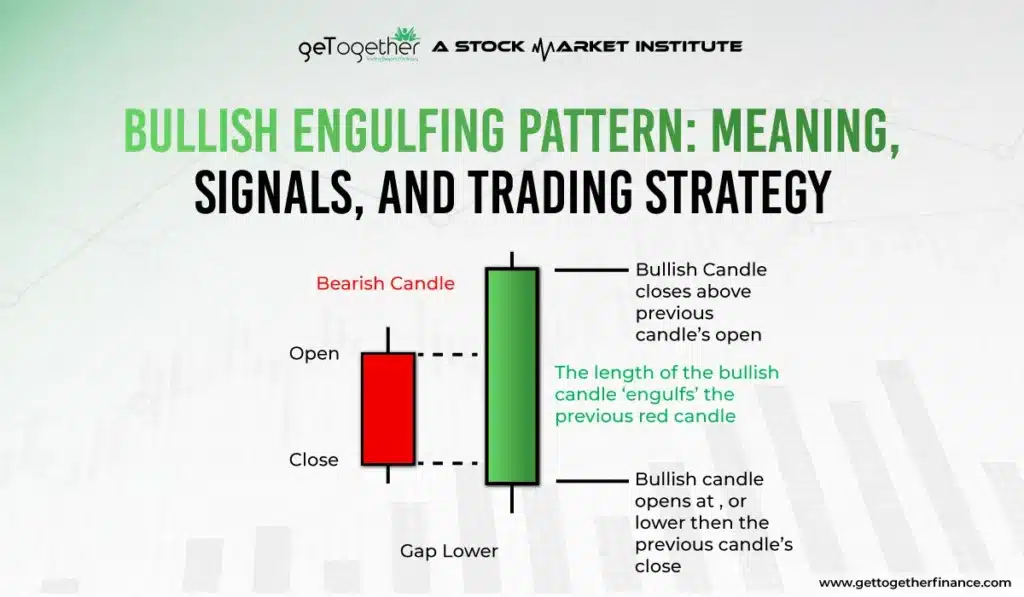
Bullish Engulfing Pattern: How to Identify, Confirm, and Trade This Reversal Signal
- Updated on : June 24, 2026
- 12598 Views
- by Arun Singh Tanwar

 Facebook
 Instagram
 Youtube
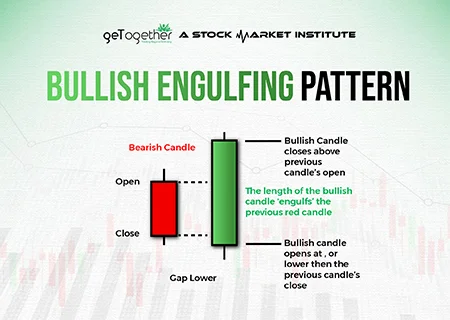
Making money has never been tough, it’s just trickier. This is what we can realize when we step into the vast pool of the stock market. It indeed has endless opportunities to make money, but all of these require an advanced understanding of technical analysis. You need to master in the art of trading, and for that you need to have a strong grip on analyzing technical charts, understanding their terminologies, and applying the theories of trading. Though there are various types of patterns in the chart, but in this blog we will majorly discuss a pattern that helps traders to easily predict the movement of stocks, popularly known as the Bullish Engulfing Pattern.
What is Bullish Engulfing Pattern?
Let us now understand the bullish Engulfing Pattern in depth. A trader always searches for a perfect pattern to enter into a trade. One such pattern is a bullish engulfing pattern. More often, the bullish engulfing pattern showcases the end of downtrends and the start of upward trends. When a new candle starts at a price lower than the previous day’s closing price, a bullish engulfing candle can be seen. This can point to a probable downward trend.
However, when buying pressure picks up, the market’s mood changes, and a fresh green candle forms. The red candle from the previous day is entirely engulfed by the green candle, notifying a rise in the stock price and buying. This indicates the start of an upward trend.
Understanding Bullish Engulfing Pattern
The pattern consists of two candles that signal a potential up move in the stock’s price. Majorly, this pattern is in a downtrend, but it can be seen in an uptrend too. The patterns forms with a small red candle that is completely engulfed by the next green candle. The significance of the pattern is that it signals that buyers have taken over the market after the continuous selling in the downtrend. Many conventional traders see this pattern as a potential buying opportunity and take long positions.
How Does The Bullish Engulfing Pattern Form?
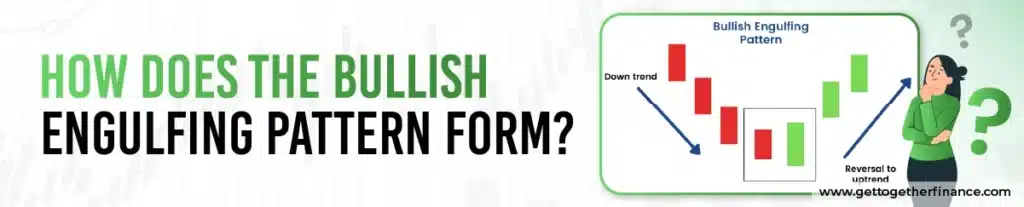
A bullish engulfing pattern forms when the market shifts from selling pressure to strong buying interest. Such a pattern is usually seen after multiple red candles in a downtrend. However, it is also said that this bullish engulfing candlestick pattern reflects weakening bearish momentum.
The first candle is a small red candle that continues the downtrend. However, the next day opens lower, suggesting further weakness—only for aggressive buyers to step in and push the price sharply higher.
Afterwards, this leads to the formation of a large green bullish engulfing candle that completely covers the previous red candle’s body. Such price action signals that bulls have taken charge, often hinting at a trend reversal and the beginning of an upward move.
How to Confirm the Bullish Engulfing Pattern?
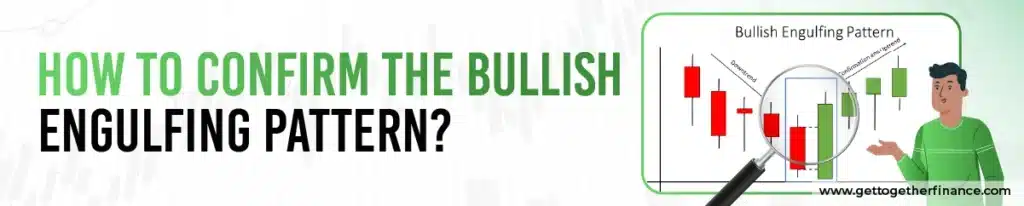
Spotting a bullish engulfing pattern is just the beginning— smart traders always wait for confirmation. After the bullish engulfing candle forms, the next trading session should ideally move above the high of the engulfing candle. This price action shows that buyers are still in control and not just reacting temporarily. Stronger volume during or after the candle further supports the shift in sentiment. Also, check if this bullish engulfing candlestick pattern appears near a key support zone or after a steady downtrend.
Read More : Tweezer Bottom Pattern
What does a bullish engulfing pattern tell you?

A bullish engulfing pattern is formed when a big green candle is formed after a red candle. The green candle here completely covers the red candle. But, this formation can be here frequently in the candlestick chart. The significance of the bullish candlestick pattern is understood when it is formed after a downtrend.
A downtrend refers to a continuous downmove in the price leading to the formation of consequent red candles. When the bullish engulfing pattern is formed after a downtrend, it signals the reversal of the trend. There are high possibility that an uptrend can be seen after the formation of this pattern.
Also Read: Bearish Candlestick Patterns
Example of a Bullish Engulfing Pattern
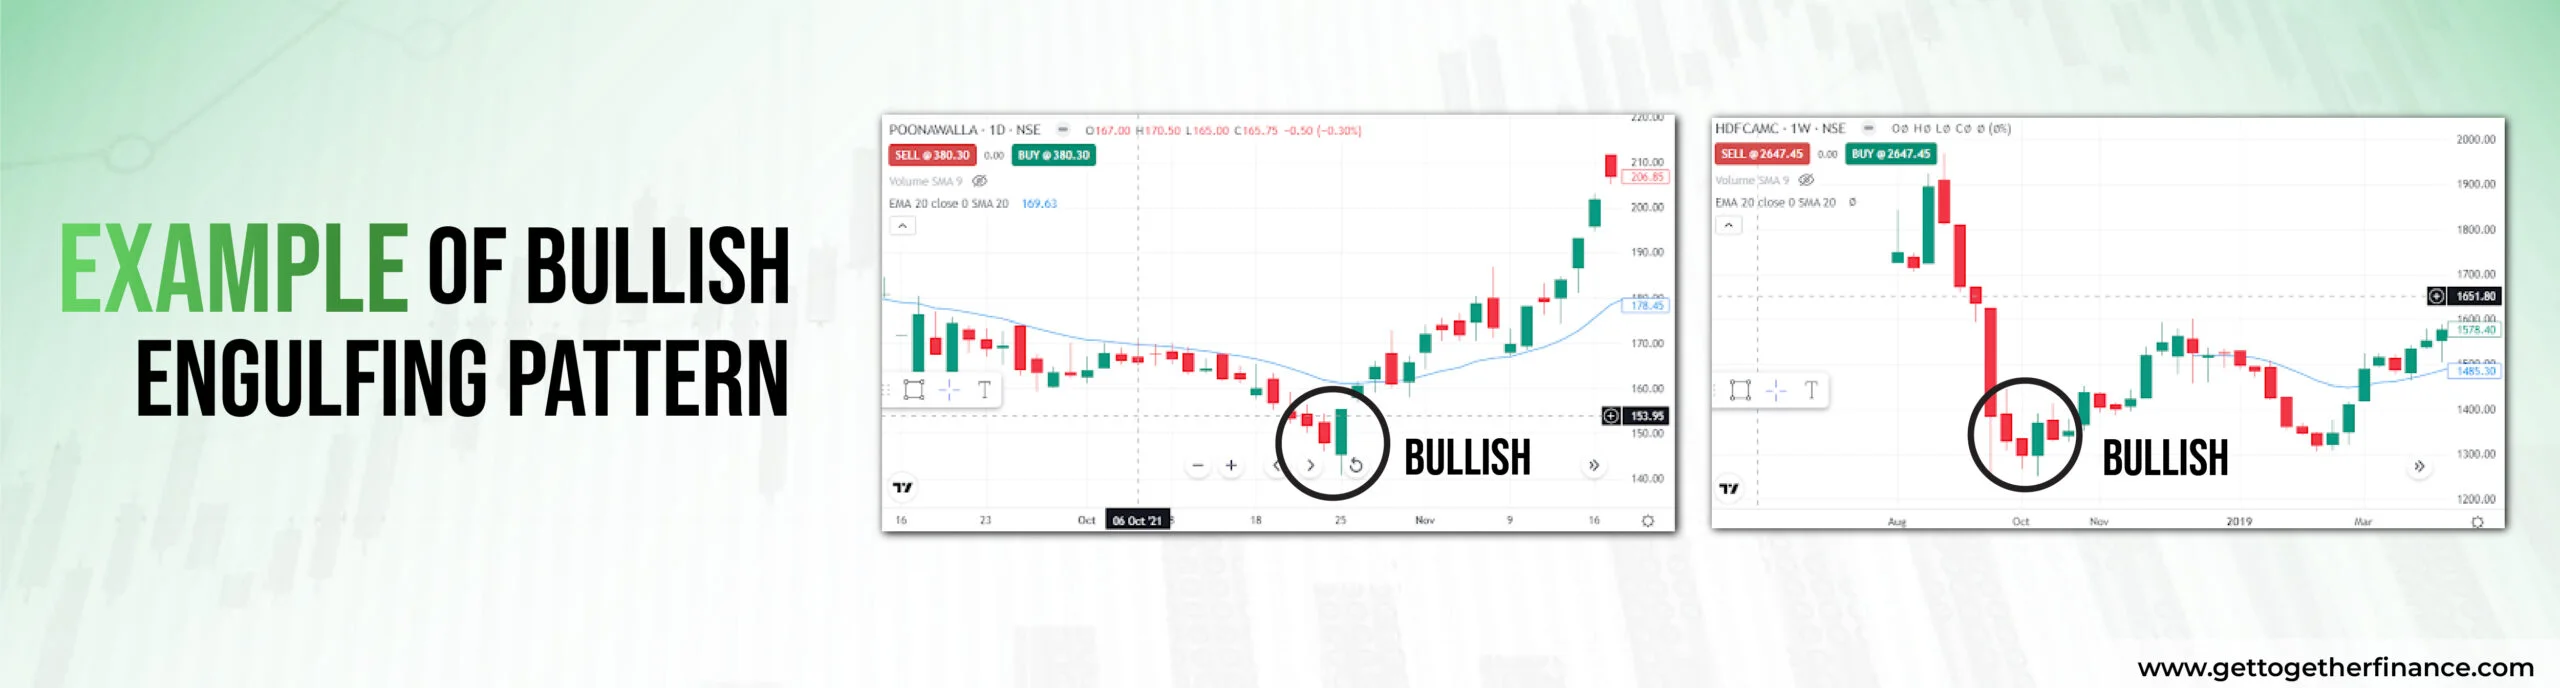
Example 1:- In the above example of HDFCAMC, a continuous downtrend can be seen from the price level of Rs2000 to almost Rs1300. After the last red candle, a green candle is formed that completely covers the red candle. Here, the bullish engulfing pattern can be seen. After the formation of the pattern, a decent upmove in the price was observed.
Example 2:- In the above example of Poonawalla Fincorp a downtrend can be seen from the price of Rs170 to the price of Rs200. Whereas, here the downtrend is broken by a bullish engulfing pattern formed at the price of 150. After the pattern, a continuous uptrend can be seen. This uptrend has given a good move of almost 25% to the stock price.
Key takeaways in Bullish Engulfing Pattern
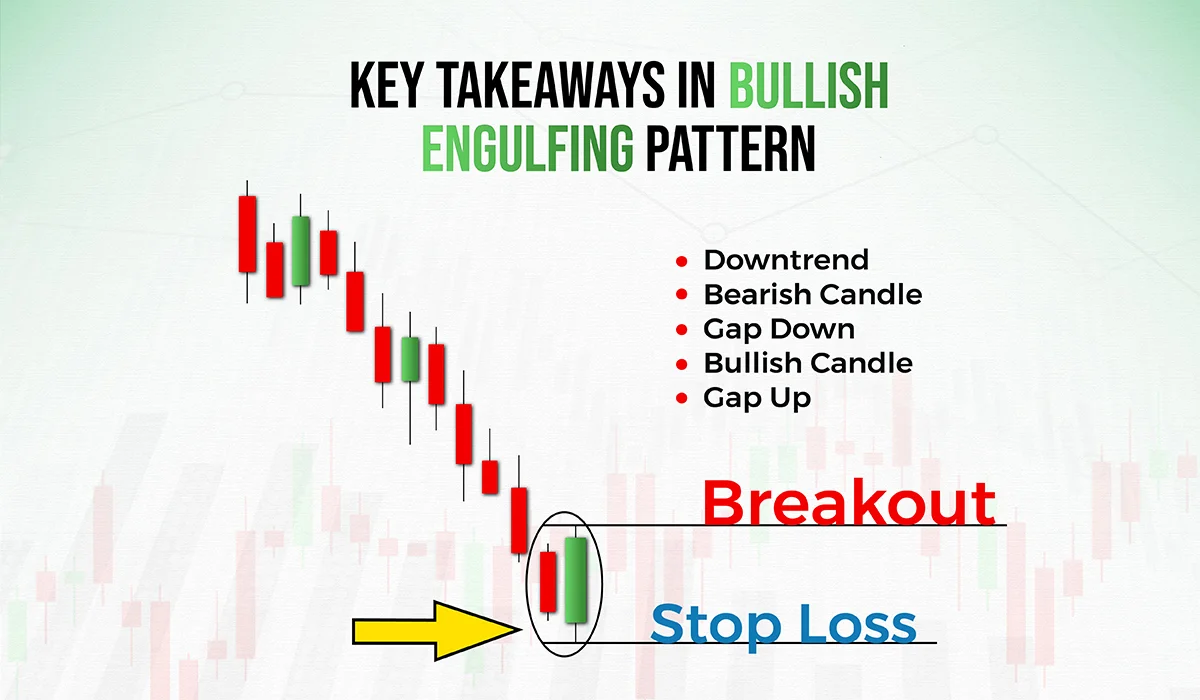
A bullish engulfing pattern indicates a new upward trend where the stock price tends to go up. After a series of red candles, the new green candles start to form. To identify this trend at the right time, traders need to have advanced knowledge of the charts and the pattern. Here are the key takeaways from the bullish engulfing pattern for better understanding:
- There are two candles; the first is red and is considered bearish; the second is green which is considered bullish.
- Stock usually opens at a lower price than the previous day’s low, often indicating a new low. However, the positive buying behavior makes the price go higher than the previous day’s close price. Resulting in the engulfing pattern.
- Change in market sentiments can be seen. When the body of the previous red candle is entirely engulfed by the green candle, it indicates a significant shift in the market mood.
- The pattern of candlesticks indicates the buying pressure on the stock.
- Traders typically wait for confirmation before executing a pattern, such as a high price or buying on following candles. whereas, if you have advanced knowledge about candlestick patterns, you would take entry at the right time and make profits ahead of others.
- The pattern suggests that a new trend has begun ending the downward trend and now there will be a positive movement in the price.
Considering the above-mentioned points, the bullish engulfing pattern offers traders a solid chance to make an entry in the trade and book catch short-term movement. It should be utilized along with other unique tools and indicators in court transactions to increase its dependability.
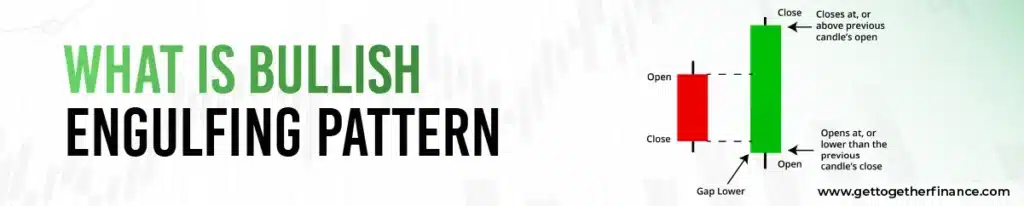
What is a Bullish Engulfing Candle?
A Bullish Engulfing Candle is a green candle formed after a red candle. This green candle totally covers the red candle and is bigger than the red candle. In a simpler way, in a bullish engulfing pattern, the red candle appears to be the small shadow of the green candle.
Bullish Engulfing Candle Reversal
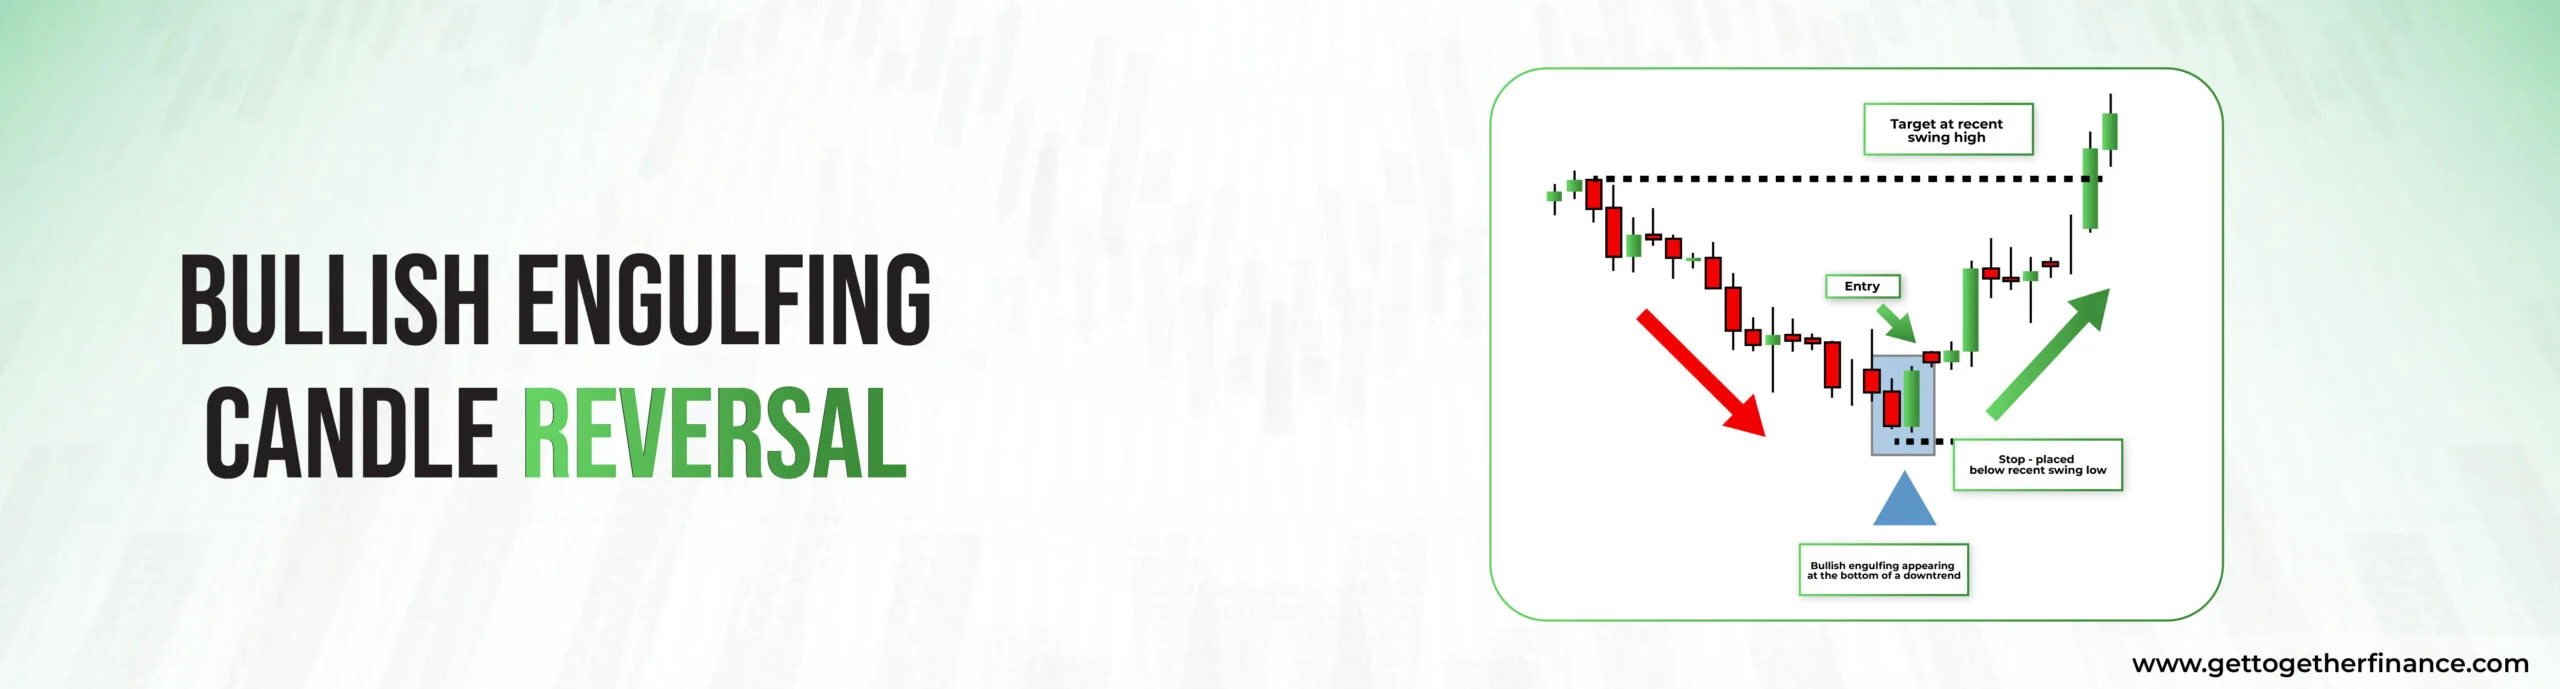
Bullish engulfing candle reversal is the bullish engulfing pattern that is seen after a downtrend. This pattern is competent enough to reverse the existing trend and give the price a good move. This pattern indicates a shift in market mood, with buyers gaining control and maybe signaling the end of the downward trend. Traders frequently interpret this as a strong buy signal, indicating an impending bullish trend. However, for more accurate forecasting, it should be checked using additional technical analysis tools.
Difference Between Bullish and Bearish Engulfing Pattern
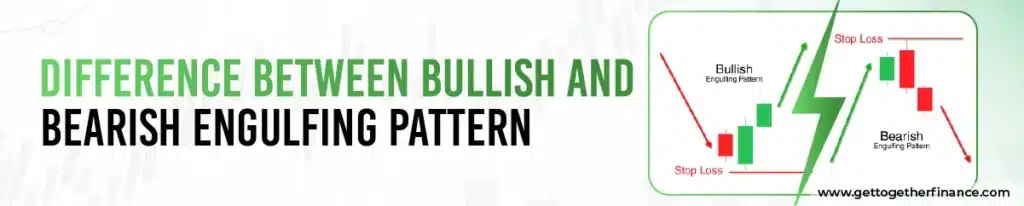
The bullish Engulfing pattern and Bearish Engulfing Pattern are just opposites of each other. Unlike the bullish engulfing, the bearish engulfing signals the start of a downtrend.
In the bearish engulfing pattern a smaller green candle is totally covered of engulfed by a bigger red candle. Here, a strong red candle after the consecutive green candle indicates that sellers are now in huge numbers compared to the buyers. Apart from this, some key differences in bearish engulfing and bullish engulfing patterns are:
| Bullish Engulfing | Bearish Engulfing |
| Indicates strong buying momentum | Indicates strong selling momentum |
| Often breaks and reverses the downtrend in the price | Often breaks and reverses the uptrend in the price |
| The green candle engulfs the red candle | The red candle engulfs the green candle |
How to Trade in Bullish Engulfing Pattern ?
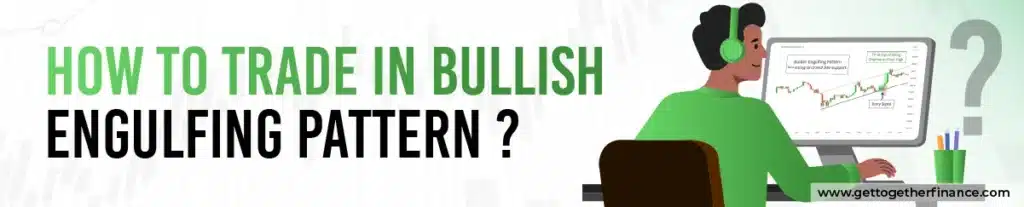
A bullish engulfing pattern signals an uptrend. However, there are several traps in the candlestick charts that can make conventional traders lose all their money. It is important to use the pattern in accordance with the demand and supply theory. Trading solely based on pattern study is never advised, as with the widespread use of patterns, they have started trapping traders. Market sentiments should be checked well before entering the trade.
In context of trading in a bullish engulfing pattern, if you want profit from the bullish trend in the stock market. Here is the step-by-step guide for trading in bullish engulfing pattern:
- Verification is a must after the detection of a rising bullish engulfing pattern on a chart. Do Check, if the bullish engulfing pattern is forming at a crucial support level or in conjunction with other technical indicators or chart patterns that confirm the bullish viewpoint. Other indicators that can add to the evidence include the moving average (Crossover), RSI, or MACD (Moving Average Convergence Divergence).
- To prevent losses, place a stop loss below the breakout candle’s minimum. Irrespective of your strong grip over the market or stock, it is an important step. This is a crucial risk management tactic to safeguard your money when the market shifts your position.
- Plan your price goals by using breaking highs, or levels that are close to resistance. Take a share of gains as the approach develops gradually, and think about using stop losses to minimize your losses.
- Depending on your tolerance for interference and the distance between your entrance point and the default location, select the appropriate position size. Limit the amount of money you risk on a trade. it should be decided after having the roadmap of trading in your head. One should never put all money in the same place, even if they are sure shot over the stock.
- After verifying the trend pattern, open a long (buy) position at the start after the bullish candle that engulfs the red candle. Try to start the trade near the moving candle’s closing price as you can reduce risk and maximize gains.
- Keep an eye on the status of your trades and be prepared to modify your stop loss or take profit levels if market conditions shift. Book profits in partial upward movements to safeguard your capital.
Limitations of Bullish Engulfing Pattern
Although a bullish engulfing pattern is an excellent bullish signal, there are certain drawbacks to it. With its widespread usage, it has started trapping conventional traders. Here are some potential drawbacks that should be considered before trading solely based on the pattern:
- False signals: Like all other conventional patterns, this pattern also gives various false signals. Proper technical analysis tools and techniques should be used before trusting the bullish engulfing signal.
- Highly Dependable on Market Trend: The pattern should be trusted along with the market. There are high chance that when the market trend is sideways, a bullish engulfing pattern will not be reliable.
- Unnecessary News and Noise: Stock market enthusiasts are easily influenced by the outside. They are unaware of the fact that news comes to them as an end user after the market has its effects already. This news affects the candlestick charts majorly, and there is a high chance that conventional patterns like bullish engulfing will not work.
- No appropriate risk management: Unlike any practical theory, this pattern does not provide any adequate risk management strategy to the trader. Various other factors, previous price data, trends, and market sentiments should be considered in this scenario.
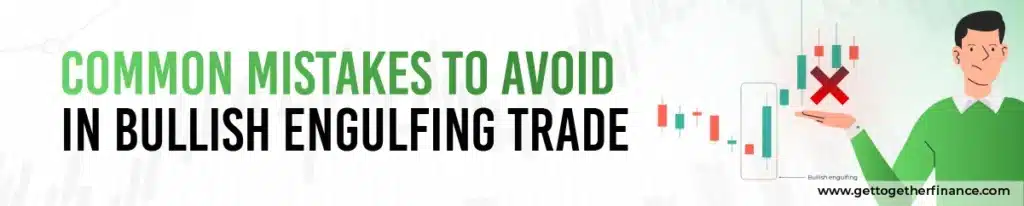
Common Mistakes to Avoid in Bullish Engulfing Trade
Many traders enter a bullish engulfing candle trade without confirmation or trade it against the trend—avoid both. Don’t jump in just because the bullish engulfing pattern appears; consider market context like support levels and price structure. Avoid placing stop-loss too tight, and do not trade during choppy markets where false candlestick engulfing patterns are common. Over-leveraging or trading every bullish engulfing candlestick pattern formation leads to losses—patience and discipline are key.
Bottom Line
The bullish engulfing pattern is a strong candlestick pattern that gives traders a practical tool for identifying future gains. If properly examined and verified, this pattern can offer excellent opportunities to participate in market dynamics. Like any other trading strategy, the bullish engulfing pattern carries some risk. Traders should exercise caution, employ effective risk management strategies, and incorporate the design with other technological tools in order to increase the design’s reliability. Traders can enhance their ability to recognise and make a profit from trading patterns with the help of practical training and expert guidance. How you choose to get that training matters – this comparison of Self-learning vs. online trading classes weighs whether teaching yourself or learning in a structured class is the better route. But, despite all the trade theories and patterns, one should spend a handful of time understanding risk mitigation strategies for losses in any type of trade.


