Doji Candlestick Pattern: Types & Trading Insights
- Updated on : March 26, 2026
- 5207 Views
- by Arun Singh Tanwar

 Facebook
 Instagram
 Youtube
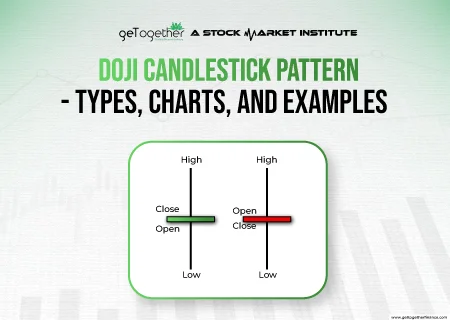
In the intricate world of stock markets, the language of candlestick patterns serves as a nuanced guide for astute investors and traders. Among these patterns, the enigmatic Doji candlestick pattern stands out, capturing the essence of market indecision and potential trend reversals.
As investors and traders, understanding candlestick patterns is critical to navigating the complexities of price action – similar to deciphering a financial Morse code. So, whether you are a seasoned professional seeking to refine your strategies or a novice enthusiast eager to grasp the essentials, understanding Doji candlestick patterns is instrumental in making informed decisions.
Hop on to know more.
What Is a Doji Candlestick Pattern?
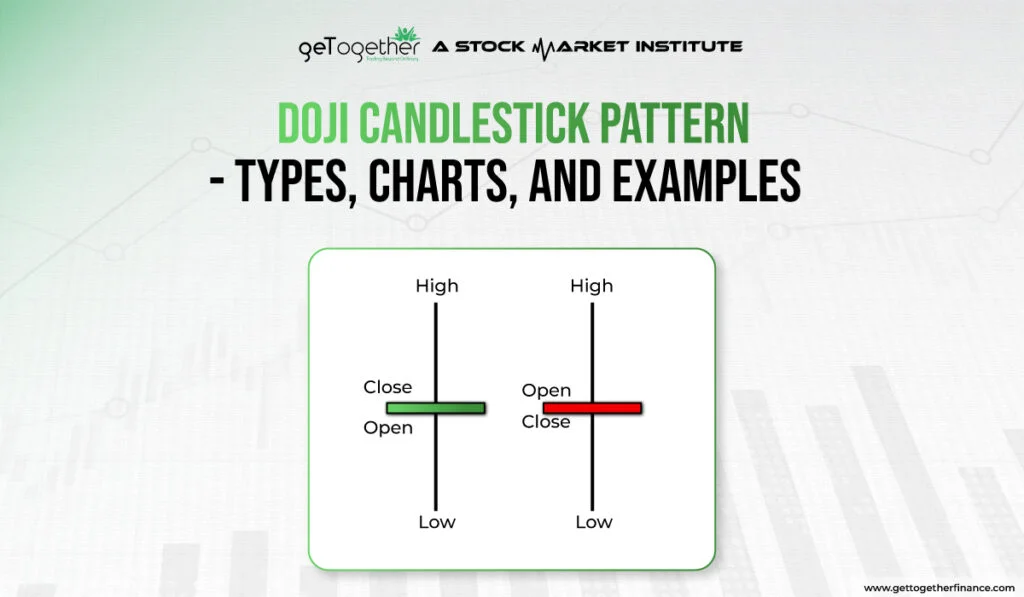
Each candlestick has four parts – an opening price, closing price, high prices and low prices of the day. Examining these will offer you an idea about the stock’s price movement. The opening and closing prices together build a thick section, called the body. The higher the difference between the opening and closing prices, the longer the candle’s real body will be. On either side, the stock’s highest and lowest prices create wickers or shadows.
The Doji candlestick pattern is one such type of candlestick chart belonging to the family of Japanese candlestick charts, invented in 17th century Japan by rice traders to trade. Its name is derived from its unique formation, which denotes indecision or mistake.
The Doji candlestick pattern often appears during an uptrend or a downtrend of a stock, signifying equality between bullish and bearish trends. It is a possible indication of a trend reversal, a moment to “pause and reflect” for more convincing patterns to appear. For instance, if a Doji candlestick pattern flashes during an uptrend, it might mean that buying momentum is slowing down. However, it can also be temporary indecision, and the stock market may continue to move in the same direction afterward.
The difference between the Doji candlestick pattern and other candlestick patterns is that it has no real body. The opening and closing values are the same, with different highs and lows. The length of upper and lower shadows (wicks and tails) vary, mimicking a plus sign, cross, or inverted cross.
How Can You Identify a Doji Candle on a Chart?
A Doji candle is one of the simplest candlestick structures to identify on a chart. It stands out because the opening and closing prices are almost identical, creating a very thin or invisible real body.
To identify a Doji candlestick pattern on a chart:
- The open and close must be the same or extremely close
- The upper and lower wicks can be long, short, or uneven
- The candle resembles a plus sign, cross, or inverted cross
- It appears frequently within trends, signalling indecision
- On a Doji candlestick chart, the candle has no noticeable body
If the candle has even a small real body (more than 5% of the total candle length), it is not a Doji—it becomes a spinning top or another pattern.
What Is the Psychology Behind the Doji Candlestick Pattern?
The Doji candlestick represents a balance between buyers and sellers, and this balance reveals the true psychology of the market.
Here’s what the pattern tells us:
- Buyers try to push the price higher
- Sellers try to push it lower
- Both fail to maintain control
- The market closes at the same level it opened
- This shows indecision, hesitation, or exhaustion
A Doji candle typically forms:
- When a trend is losing strength
- When traders are waiting for confirmation
- When the market is rebalancing supply and demand
This is why a Doji often appears near trend reversals or major support/resistance areas.
Types of Doji Candlestick Patterns
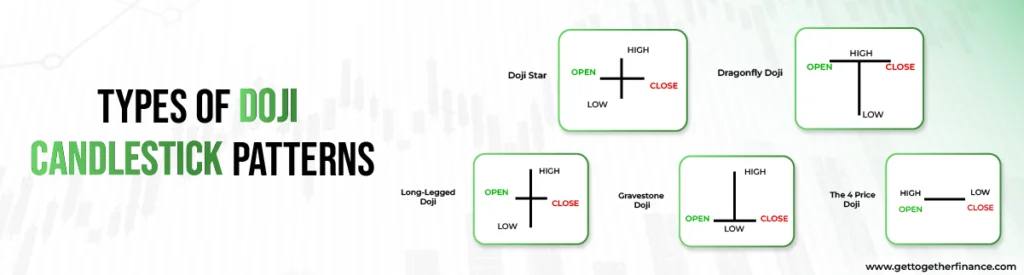
The following are the different kinds of Doji candlestick patterns:
Doji Star Candlestick Pattern
The Doji star candlestick pattern resembles a star with identical opening and closing values and equal lengths of upper and lower wicks. It appears when neither a bullish nor bearish trend is significant enough to sway market sentiment.
Dragonfly Doji
This Doji candlestick pattern lies at the bottom of a downtrend, signifying rejection of lower prices. Dragonfly Doji does not represent market indecision but signals a potential reversal of the upward trend. You can identify this pattern from its unique appearance, long bottom wick, and no real body. Dragonfly Doji indicates that sellers initially drove prices higher, but buyers took control by the end of the session, driving prices back up to the session high.
Long-legged Doji
This is a Doji star candlestick pattern with extended upper and lower wicks. It also denotes uncertain sentiment with higher volatility.
This type of Doji candlestick pattern represents a considerable amount of indecision as neither sellers nor buyers take control.
Gravestone Doji
The Gravestone Doji candlestick pattern is the opposite of Dragonfly Doji. It appears during an uptrend, indicating market rejection for higher prices. It does not have a real body and extended upper shadow. Gravestone Doji denotes that buyers initially pushed prices higher, but sellers took control toward the session’s end, pushing prices back down to the session low.
4-price Doji
4-price Doji appears as a single horizontal line or a pretty small cross, depicting high-level market indecision. It is characterized by having all four price levels – open, close, high, and low – significantly close to each other, resulting in a small or nonexistent real body.
Also Read: Marubozu Candle
How Can You Trade Using Doji Candlestick Patterns?
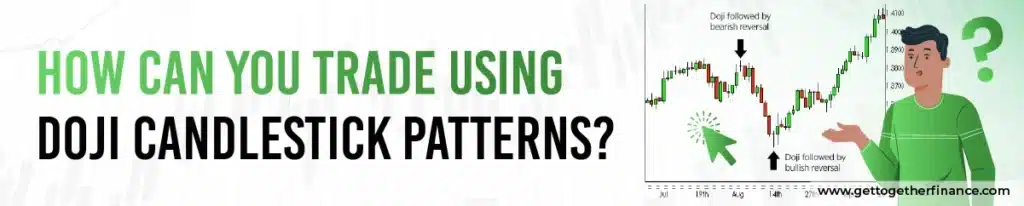
Doji candlestick patterns by themselves do not give buy/sell signals. Instead, they act as context candles, helping traders understand whether a trend may pause, reverse, or continue. Here’s how you can trade them:
1. Combine Doji with Support and Resistance
- A Doji at support may signal a potential bullish reversal
- A Doji at resistance may signal a bearish reversal
2. Use Trend Context
- In an uptrend → A Doji suggests buying strength is slowing
- In a downtrend → A Doji suggests selling pressure is easing
3. Wait for Confirmation
The next candle after a Doji is what confirms the move.
- A bullish candle after a Doji = possible long entry
- A bearish candle after a Doji = possible short entry
4. Use Multi-candle Patterns
- A bullish candle after a Doji = possible long entry
- A bearish candle after a Doji = possible short entry
Some Dojis become part of well-known patterns like:
- Morning Doji Star
- Evening Doji Star
These offer stronger signals than a single Doji candle.
What Volume Conditions Strengthen a Doji Candle Signal?
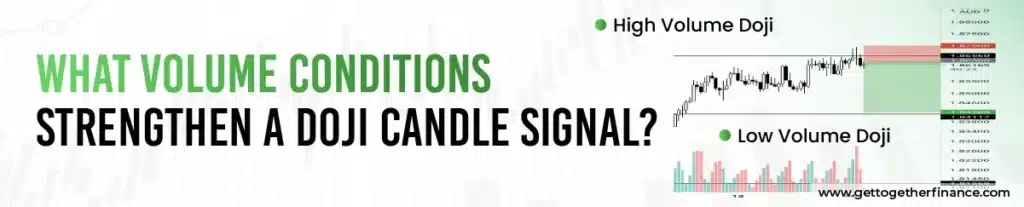
Volume is an important factor when reading a Doji candlestick chart. It helps decide whether the indecision is meaningful or just market noise. Here’s how volume improves reliability:
High Volume Doji
- Shows strong conflict between buyers and sellers
- Often appears before major reversals
- Indicates serious market indecision
Low Volume Doji
- Usually signals weak trading activity
- Indicates temporary pause, not a reversal
- Should not be used alone for trading decisions
Best interpretation: A Doji on a key price level with above-average volume is a more reliable indication of a potential trend change.
Understanding the Doji Candlestick: Morning Doji Star Candlestick Pattern and Evening Doji Star Candlestick Pattern
On a broad basis, there are about a hundred Japanese candlestick patterns, such as bullish vs. bearish and reversal vs. continuation, as well as simple and more complex formations.
The morning Doji star candlestick pattern and evening Doji star candlestick patterns are two such types of pattern that are more complex formations, mostly because they are based on three successive candles.
The Morning Doji Star Candlestick Pattern
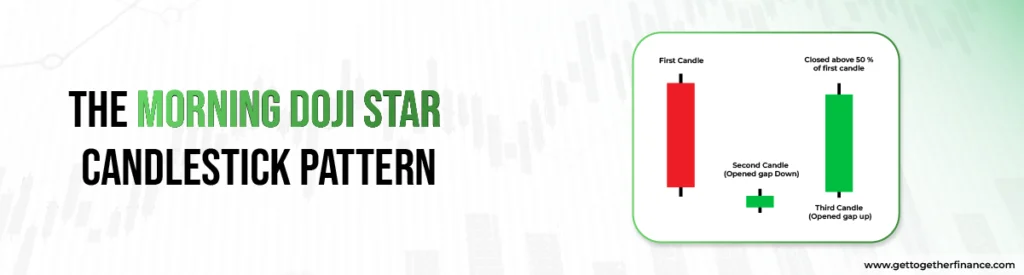
The morning Doji star candlestick pattern appears on price charts, signaling a potential downtrend reversal. It is formed over three consecutive days and contains the following four elements:
First Candle (Bearish)
The morning Doji star candlestick pattern begins with a long bearish (downward) candle, indicating a prevailing downtrend.
Second Candle (Doji)
The second day forms a Doji candle, characterized by a small real body where the opening and closing prices are pretty close or identical. The Doji represents indecision and a potential loss of momentum in the downward trend.
Third Candle (Bullish)
The third day completes the pattern with a long bullish (upward) candle. This candle opens higher than the previous day’s (Doji) close and closes near or above the midpoint of the first day’s bearish candle. The bullish candle signifies a potential reversal in sentiment as buyers regain control.
The Evening Doji Star Candlestick Pattern
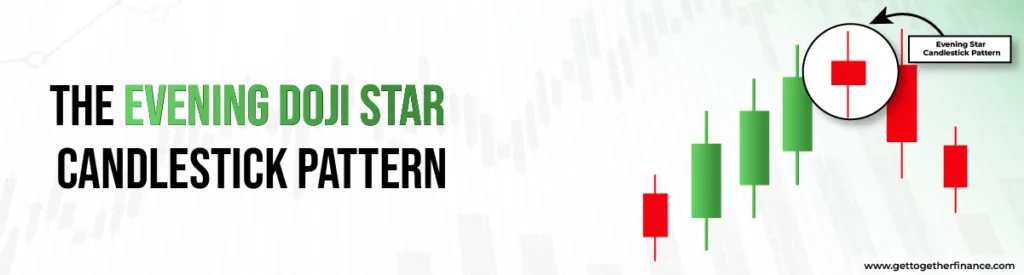
On the other hand, the evening Doji star candlestick pattern has the same structure and is also a reversal pattern. Unlike the morning star, the evening Doji star candlestick pattern occurs at the top of an uptrend and signals a potential change in the price movement.
Alt three conditions in the morning star structure are also valid for the evening Doji star candlestick pattern. Near the end of an uptrend, the first candle should be long and bullish, and the second one should be at the top and signal indecision. In contrast, the third and final candle signals the start of a reversal as buyers are no longer in control over the price action.
Why are doji candles important?
The following factors underscore the importance of Doji candlestick patterns for traders:
Potential Trend Reversals
Dojis occurring within established trends, especially at key support or resistance levels, often act as warning signs. They indicate a potential momentum shift, suggesting that the current trend might lose steam and a reversal could be brewing.
Volatility Prediction
The length of the upper and lower shadows (wicks) of a Doji provides information about market volatility. Long shadows indicate higher volatility, while short shadows suggest lower volatility. Traders use these insights to check how uncertain the market is.
Variety of Information
Multiple Doji variations—gravestone, dragonfly, and long-legged—offer more specific information. Each type, based on the shadows’ length and surrounding context, hints at specific sentiments like bullish or bearish indecision.
Doji Candlestick Pattern vs. Spinning Top
Doji and spinning tops both are similar in nature, and represent market indecision.
- Real Body Size: If the candlestick’s real body is around 5% of its total size, it is called Doji. Else, it is a spinning top.
- Market Indecision: Doji candlestick patterns signify strong market indecision with equal open and close, whereas spinning top indicates indecision with a larger range between open and close.
When either appears in the trading chart, look for other indicators, such as Bollinger Bands, before planning entry or exit.
What’s the Difference Between Doji, Hammer, and Spinning Top?
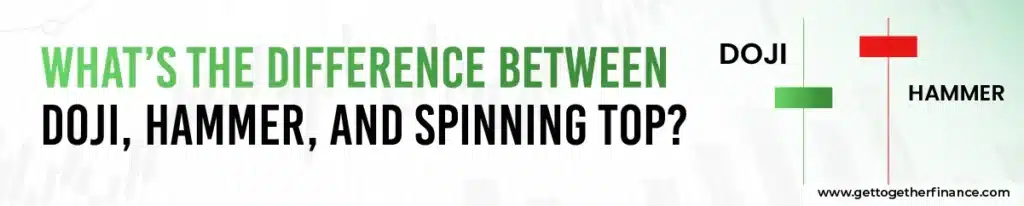
These three candle types often confuse traders, but they communicate different messages:
- Open = Close
- No real body
- Shows indecision
1. Doji Candlestick
- Open = Close
- No real body
- Shows indecision
2. Hammer Candlestick
- Small real body at the top
- Long lower wick
- Shows bullish rejection of lower prices
3. Spinning Top
- Small real body but not zero
- Balanced upper and lower wicks
- Shows mild indecision
Key difference:
- A Doji shows stronger indecision
- A Hammer shows strong rejection
- A Spinning Top is moderate indecision but not as strong as a Doji
How Reliable Are Doji Candlestick Patterns in Different Timeframes?
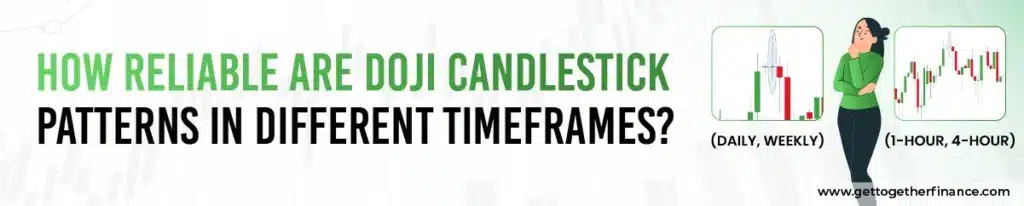
The reliability of a Doji candlestick pattern changes with timeframe:
Higher Timeframes (Daily, Weekly)
- More reliable
- Show market-wide indecision
- Useful for swing and positional traders
Medium Timeframes (1-hour, 4-hour)
- Fairly reliable
- Good for identifying early reversal signs
Lower Timeframes (1-min, 5-min, 15-min)
- Less reliable
- Too much noise
- Many false Doji formations
In general, the Doji candle is more meaningful when:
- It forms at a major support/resistance zone
- It appears with significant volume
- It is followed by a strong confirmation candle
Limitations of the Doji Candlestick Pattern
While the Doji candlestick pattern is a valuable tool in technical analysis, it comes with certain limitations that investors and traders alike must be aware of:
- False Signals: Doji patterns occasionally produce false signals. Market indecision, which the Doji represents, may not always lead to a reversal or significant price movement. Sometimes, it could simply indicate a temporary pause in the trend.
- Market Volatility: Doji patterns may be less reliable in highly volatile markets. Extreme price fluctuations and sudden market movements make it challenging to interpret the significance of a Doji accurately.
- Time Frame Sensitivity: The effectiveness of Doji patterns varies based on the chart’s time frame. What appears as a Doji on a shorter time frame might not have the same implications when viewed on a longer time frame.
- Overuse: Due to their prevalence in charts, Doji patterns might be overused, leading to a situation where traders interpret them too frequently. Relying solely on Doji signals without considering technical factors can result in suboptimal decision-making.
- Lack of Specificity: While Doji patterns indicate indecision, they do not provide specific information about the direction or magnitude of a potential price movement. Traders need to complement Doji analysis with demand & supply theory to make informed decisions.
Lastly, Predict a Price Reversal Using a Doji Candlestick Pattern
Here’s how you can predict a price reversal in Doji Candlestick pattern:
- Reversal Precursor: The Doji candlestick pattern often emerges when a price reversal is around the corner. This acts as an early indicator of an impending shift in market direction.
- Indecision Showcase: The Doji pattern reflects market indecision, capturing the balance between buyers and sellers.
- Shift in Sentiment: Doji means more than just neutrality; it implies a potential transition in investor sentiment. Seasoned traders take this as their sign to prepare for changes in market dynamics.
Final Words
High-probability trades are identified through a convergence of entry and exits based on the trends of support and resistance (Demand & Supply). Without identifying those two components in advance, a Doji is just a tiny piece of information that helps a trader determine a higher probability point to enter and/or exit a position.However, when used in conjunction with other forms of analysis, Doji candlestick patterns can help confirm or negate significant highs/lows. This, in turn, allows a trader to determine whether a short-term trend will likely reverse or continue.
The world of trading can be confusing, even a bit overwhelming. Why not learn the basics from the best? GTF Traders – India’s most trusted stock market institute when it comes to stock markets. Keep up with the latest strategies, with proper risk management techniques taught to you by well-established market leaders.
FAQ
What is a Doji candlestick pattern?
A Doji candlestick pattern in technical analysis appears when the opening and closing prices of a particular stock are nearly equal. It is not a strong indicator but suggests a potential trend reversal, especially when showing up after an uptrend or downtrend.
How is a Doji different from other candlesticks?
A Doji’s body is virtually non-existent, meaning there is minimal difference between the opening and closing prices. Other candlestick patterns have varying body lengths depending on the price difference between opening and closing. Additionally, Dojis primarily signify market indecision, while other candlesticks convey information like bullish/bearish trends and continuation/reversal patterns
What does a Doji indicate in technical analysis?
A Doji indicates uncertainty between buyers and sellers. Its formation, with a small body, signifies that the opening and closing prices are pretty close. Traders interpret Doji as a potential reversal or a pause in the prevailing trend, prompting caution and a close watch for possible shifts in market sentiments.
Are Doji patterns reliable signals for traders?
While the Doji candlestick pattern can show valuable signals, they do not guarantee definite price direction. To improve trading accuracy, you should combine it with technical factors, including volume analysis, trend identification, and support/resistance zones. Moreover, analyzing market conditions makes Dojis more meaningful.
How do market analysts interpret Doji formations?
Market analysts interpret the Doji pattern based on:
Context: In trends, Dojis near highs/lows reflect potential reversals. In sideways markets, they’re less meaningful.
Type: Dragonfly/Gravestone Dojis hint at bullish/bearish reversals, while others show indecision.
Confirmation: Dojis alone are weak signals. Analysts confirm from other indicators—volume, momentum, and support/resistance—for stronger trading signals.
Can a single Doji candle impact trading decisions?
Yes, a single Doji candle can impact trading decisions, especially when it occurs at significant support or resistance levels, or after a prolonged trend. Traders often interpret a Doji as a signal of market indecision and potential reversal, prompting them to exercise caution or consider adjusting their positions. However, further confirmation from other indicators, such as trends, volume, or support/resistance levels, is critical instead of solely relying on a single chart pattern.
What market conditions favor Doji candle patterns?
The following market conditions favor Doji candlestick patterns:
Established uptrends or downtrends
Significant support or resistance levels
Periods of stock price consolidation, characterized by low volatility and uncertainty
High trading volumes
Are there variations of the Doji candlestick?
The Doji candlestick pattern has these variations:
Dragonfly Doji: Long lower shadow, no upper shadow—hints at a possible bullish reversal from a downtrend.
Gravestone Doji: Long upper shadow, no lower shadow—suggests a potential bearish reversal from an uptrend.
Long-Legged Doji: Both upper and lower shadows are long, signifying strong indecision and possible trend continuation.
Four-Price Doji: Rare pattern with all four prices (open, high, low, close) identical, indicating maximum indecision and potential volatility.


