How to Identify and Trade Market Peaks and Troughs Effectively
- Updated on : May 23, 2026
- 5010 Views
- by Suhani

 Instagram
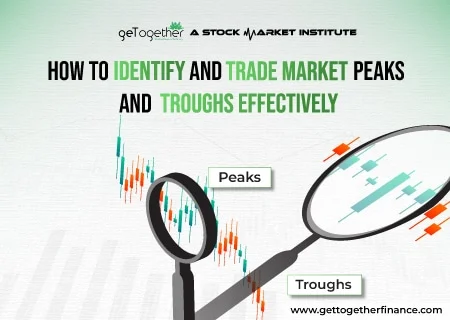
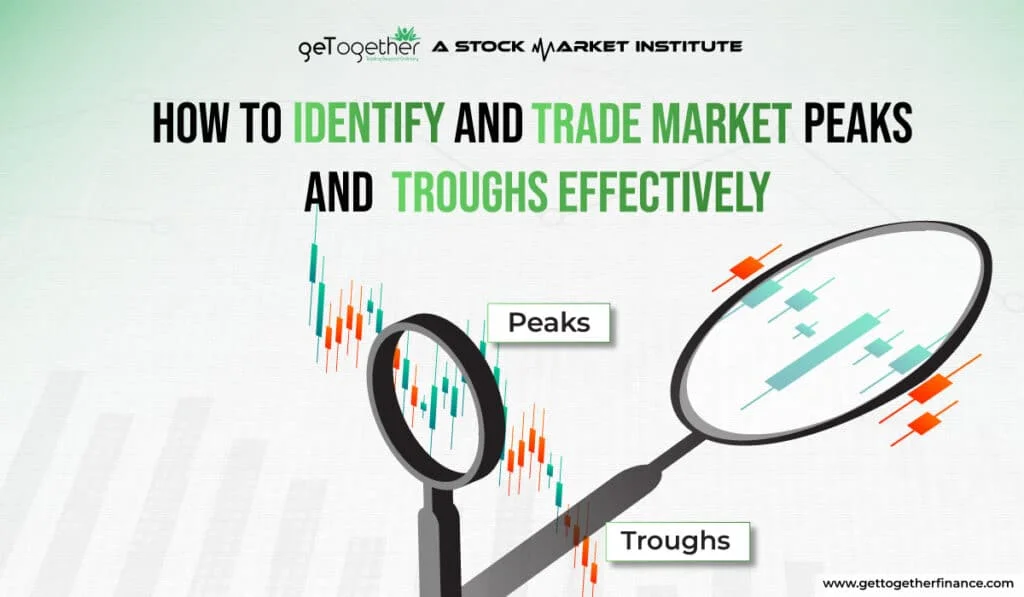
Nothing in life goes in a straight line, then how can prices of stocks or securities go in a straight line? The rising and downfall pattern of the price in the chart can be seen in zig-zag form, which depicts the price points security or stock price navigated before reaching the top or making a new low. The zig-zag pattern of the price consists of two main components; Peaks and Troughs. Peak represents the high points made by price and trough represents the low points made by price. Understanding it by visualizing a valley; the peak of the valley can be interpreted as the peak of the price, whereas the low points in the depth of the valley as the trough of the price.
By the end of this blog, you’ll be equipped with the strategies to spot and utilize market peaks and troughs. Let’s get started!
What is Peak in the Stock Market?

Peak refers to the new high price given before coming down. When the price rises to a certain point with an increase in buying pressure, it forms a peak in the chart, but when the institutions and retailers start booking profit, the selling pressure takes the price down to a certain point. The high point between this buying and selling can be termed as peak. In simple words, the peak is formed at the point where the price has gone farthest before reversing.
Peaks and Resistant Points
Resistant points in the candlestick charts are points where the price has faced bearish reversal more than 2 times. With this, traders interpret that some selling pressure is at certain price points near peak points that prevent the price from going up from there. Hence, giving it a good trend reversal.
What is Trough in the Stock Market

Trough refers to the new low price given before gaining momentum and giving an upward rally. When the price falls to a certain point with significant selling pressure, it forms a trough in the chart, but when the institutions and retailers start buying the dip, the buying pressure takes the price up to a certain point. Contrary to the peak, the low point between this selling and buying can be termed as the trough. In simple words, the trough is formed at the point where the price has gone lowest before reversing.
Trough and Support Points
Support points in the candlestick charts are points where the price has faced a bullish reversal more than 2 times. With this, traders interpret that some buying pressure is at certain price points of a trough that is preventing the price from going down from there. Hence, the price easily gets a trend reversal.
How to Find Peaks and Troughs in CandlestickCharts?

In technical analysis, peaks and troughs are traced by closely analyzing price movements on candlestick charts. A peak occurs when a high point is formed amidst an uptrend, indicating a potential reversal or resistance level. Conversely, a trough forms when a low point is established in an uptrend, suggesting a possible reversal or support level.
Peaks
To find peaks, traders need to typically look for:
Highest point: The highest points reached during an uptrend, from where the price rally started reversing.
Overbought Situations: Peak is often accompanied by overbought conditions; which can be easily signaled by technical indicators like the Relative Strength Index (RSI) or divergence patterns between price and momentum indicators along with price action.
Resistance Point: A good resistance point can be found at peaks, which somehow stops or resists the price from going above a certain point.
Trough
To find Troughs, Traders need to look for:
Lowest Points: Troughs are identified by locating the lowest points in a downtrend, where selling pressure starts losing its momentum against the buying pressure, potentially signaling a reversal.
Oversold Situations: Technical tools such as trendlines, moving averages, and volume analysis along with price action can help confirm the presence of troughs and provide insights into potential buying opportunities.
Support Point: A good support point can be found at the trough, which somehow supports the price to rise from the down point.
By systematically analyzing price action and employing technical indicators, traders can effectively identify peaks and troughs, allowing them to make informed decisions regarding entry and exit points in the market.
Also Read: Rounding Bottom
Dealing with Market Peaks

Here’s how peaks can help you in investing and trading:
- Profit booking: It seems to be a good time for booking profits after enjoying a good upward rally.
- Stop Loss Trailing: Combining all the factors with your technical analysis, if the study says that the uptrend may continue, then you can trail stop loss from the peak.
- Diversification: No sector remains at peak all the time, use peaks as an opportunity to diversify the portfolio according to the sector’s ups and downs. Diversify your portfolio across different asset classes and sectors to mitigate the impact of a market downturn.
Dealing with Market Troughs

Here’s how Market Through can help you in trading and investing:
- Buying the Dip: The troughs coincide with excellent supply areas and can be taken as an opportunity for a long. Both in the sector and in stock.
- Value Investing: Sometimes stocks fall after buying at a higher price, but if technical analysis helps in analyzing a good dip, you can use this opportunity to average your shares and then enjoy an upward rally from the trough.
- Patience and Discipline: Maintain a disciplined investment approach and avoid making impulsive decisions based on short-term market fluctuations.
How Do Peaks and Trough Help in Trading?
Peaks and Trough work as excellent support and resistance levels in technical trading. Though they are not 100% reliable, they work as an excellent add-on in various technical trading strategies.
The peak from where the price faced trend reversal interprets that excessive selling pressure must be there, leading to a lot of pending sell orders too. There is a high chance that if the price goes to a peak point again, the fall may come because of excessive selling created by pending selling orders.
The same happens in the form of a trough, from where the price faced trend reversal interpreted that excessive buying pressure must be there, leading to a lot of pending buy orders too. There is a high chance that if the price goes to that trough point again, the trend reversal may come because of excessive buying created by pending buying orders.
Demand and Supply Theory with Price Action

Identifying the reliable peaks and troughs requires advanced technical analysis. The price action combined with demand and supply theory is needed to find where the most pending orders of institutional lie for both selling and buying orders. If the peak coincides with a good demand area and through with a good supply area, then your trade setup becomes stronger.
And price action knowledge is required to study how price traveled till those points, it is important to know how price is reacting to certain stimulators.
Conclusion
Understanding market peaks and troughs is critical to effective trading and investing. Peaks reflect the greatest prices obtained before reversing, and troughs represent the lowest positions before a prospective upward rise. Using technical analysis tools like candlestick charts and support/resistance levels, investors may detect key turning points and make informed judgements. Peaks can indicate possibilities for profit-taking and diversification, but troughs present opportunities to buy the dip and practice value investing. However, while dealing with market volatility, patience, discipline, and a long-term view are essential. By combining these tactics and capitalizing on the insights afforded by peaks and troughs, investors can improve their prospects of financial success in volatile market conditions.
FAQ’S
What are some common indicators used to identify market peaks and troughs?
Moving averages, relative strength index (RSI), and MACD (Moving Average Convergence Divergence) are popular technical indicators used by investors to identify peaks and trough patterns. Additionally, patterns in candlestick charts, such as double tops or bottoms, might indicate prospective peaks or troughs.
How can investors differentiate between a temporary market peak or trough and a more significant trend reversal?
Distinguishing between transient fluctuations and serious trend reversals necessitates a thorough examination of several elements. Long-term trends, volume patterns, and fundamental considerations should be evaluated alongside technical indicators when determining the strength and duration of probable peaks and troughs.
What risk management strategies should investors employ during market peaks and trough?
During market peaks, investors may consider using profit-taking tactics, trailing stop-loss orders, and diversification to safeguard profits and reduce downside risk. In contrast, during market downturns, investors can take advantage of buying opportunities while adhering to disciplined investment techniques and properly managing risk.
What role does investor sentiment play in identifying market peaks and troughs?
Investor sentiment, which is frequently evaluated by surveys, social media sentiment research, and news headlines, can provide useful insights into market peaks and troughs. Peaks are frequently accompanied by extreme optimism and exhilaration, whilst troughs are marked by fear and pessimism. Monitoring sentiment indicators can help investors assess market sentiment and identify potential turning points.
How can investors use market peaks and troughs to develop a successful investment strategy?
Understanding market peaks and troughs can assist investors in creating a proactive investment strategy that includes both risk management and opportunistic techniques. Recognising the signals of market exuberance or pessimism allows investors to modify their portfolio allocations, locate buying or selling opportunities, and maintain a disciplined approach to meeting long-term financial objectives.


