
Price Action Trading: Definition, Strategies & Patterns Explained
- Updated on :
- 3292 Views
- by Arun Singh Tanwar

 Facebook
 Instagram
 Youtube
 Linkedin
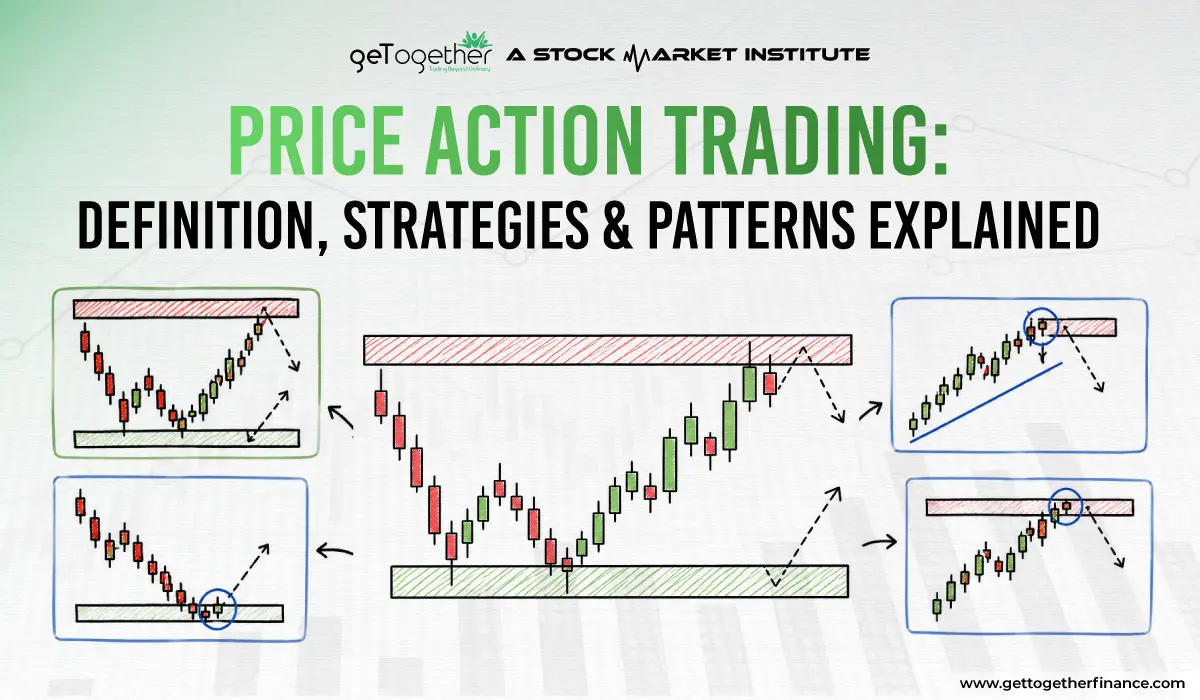
Price action in trading is a popular trading method that involves analysing price movements on a chart; some traders even trade options based on price action. Instead of relying primarily on indicators or other tools for technical analysis, this strategy focuses on the actual price movement of an asset. By observing and interpreting price patterns, traders can gain insights into market behaviour and make informed trading decisions.
In this blog, we will explore the key principles, strategies, patterns, and timeframes used in price action trading. We will also understand how price action compares with indicator-based trading.
What is Price Action in Trading? A Beginner’s Guide
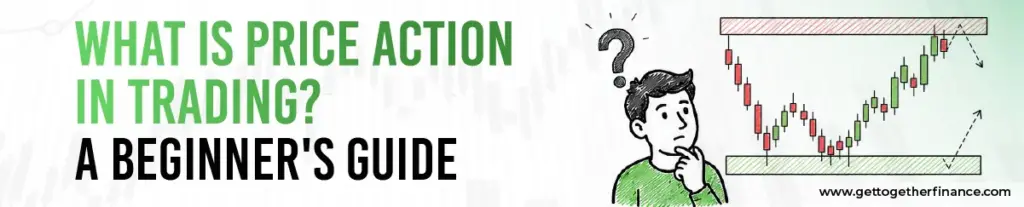
Price action refers to how an asset’s price moves on a chart over a specific period of time. It involves using demand and supply dynamics to interpret price movements and analyse the patterns that emerge from observing an asset’s closing, high, and low prices.
Unlike indicator-based strategies, price action trading focuses purely on raw price data, making it one of the cleanest and most direct forms of technical analysis available. Price action traders believe that price movements already reflect the emotions and opinions of all market participants. This is why recognizable patterns and trends consistently appear on charts.
After understanding the price action in trading, let’s now look at the key principles.
5 Key Principles of Price Action Trading Every Trader Must Know
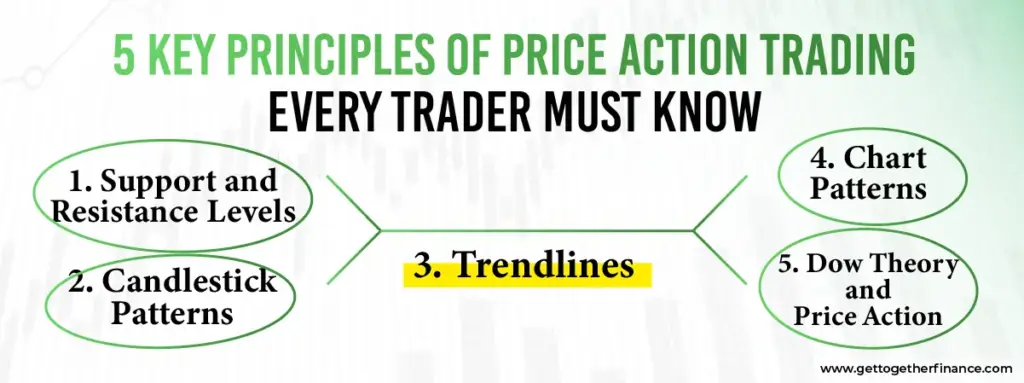
To effectively utilise price action strategies, traders need to understand and apply these five core principles. These principles help traders read price movements, understand how the market behaves, and spot potential trading opportunities. In this section, we’ll look at the key concepts that form the foundation of price action trading.
1. Support and Resistance Levels
Support and resistance levels are key areas on a price chart where the price has historically shown a tendency to reverse or stall. Predicting future price movements requires analyzing price action patterns, trends, and support & resistance levels. Traders can maximize their profits and make well-informed decisions by understanding demand and supply dynamics. Traders often use these levels to identify entry and exit points, set stop-loss orders, and determine potential profit targets.
2. Candlestick Patterns
Price action analysis continually uses candlestick charts. Candlestick patterns, such as the hammer and engulfing patterns, provide valuable insights into the sentiment of the market and work as an add-on confirmation that can point to potential reversals or continuations.
3. Trendlines
On a chart, trendlines connect consecutive highs or lows. They enable traders to make decisions based on the trend’s continuity or potential reversal by assisting in the identification of the trend’s path and strength.
4. Chart Patterns
Price movements create chart patterns such as head and shoulders, double tops, and triangles that can point to breakouts or reversals. Price action traders frequently use these patterns to find trading opportunities on charts.
5. Dow Theory and Price Action:
Dow Theory is a foundational methodology in technical analysis used to identify and predict market trends. It relies on analysing the movements of two market indices and aligns closely with price action principles by emphasising trend confirmation and market structure.
Once you have understood the key principles of price action trading, let’s look at some strategies traders can use to apply these principles when analysing price movements.
Top 4 Price Action Trading Strategies That Work
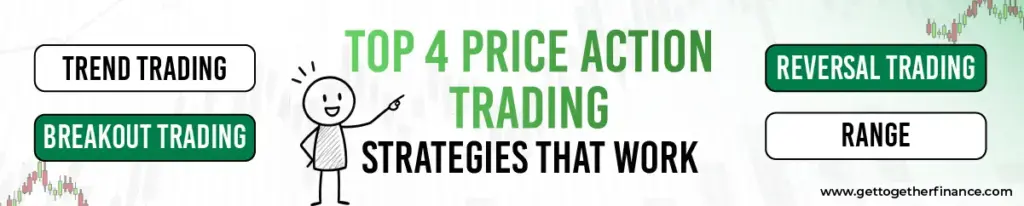
Price action trading strategies can be applied across various markets and timeframes. Here are the four most effective price action trading strategies used by traders worldwide. Each strategy focuses on reading price movements and spotting potential trading opportunities based on how the market behaves. Which strategy you choose depends on the market conditions, timeframe, and your trading approach.
1. Trend Trading
Trend trading identifies and trades with the general trend. Traders look for higher highs and higher lows in an uptrend or lower highs and lower lows in a downtrend to enter trades in the direction of the trend.
2. Breakout Trading
Breakout trading involves identifying essential support or resistance levels, and patterns and trading the breakout when the price moves beyond those levels. Traders aim to capture price movements that often occur after a breakout.
3. Reversal Trading
Traders look for signs of exhaustion in an ongoing trend, such as overextended price moves or bearish/bullish candlestick patterns. They use these signs to enter trades in the opposite direction, a practice also known as “catching a falling knife.
4. Range Trading
Range trading involves remembering price ranges where the price tends to oscillate between support and resistance levels. Traders buy near support and sell near resistance, taking advantage of the price range’s predictability.
Applying different price action trading strategies requires discipline and proper risk management. That’s why it is important to look at some practical do’s and don’ts for price action traders.
Tips for Successful Price Action Trading: Do’s & Don’ts
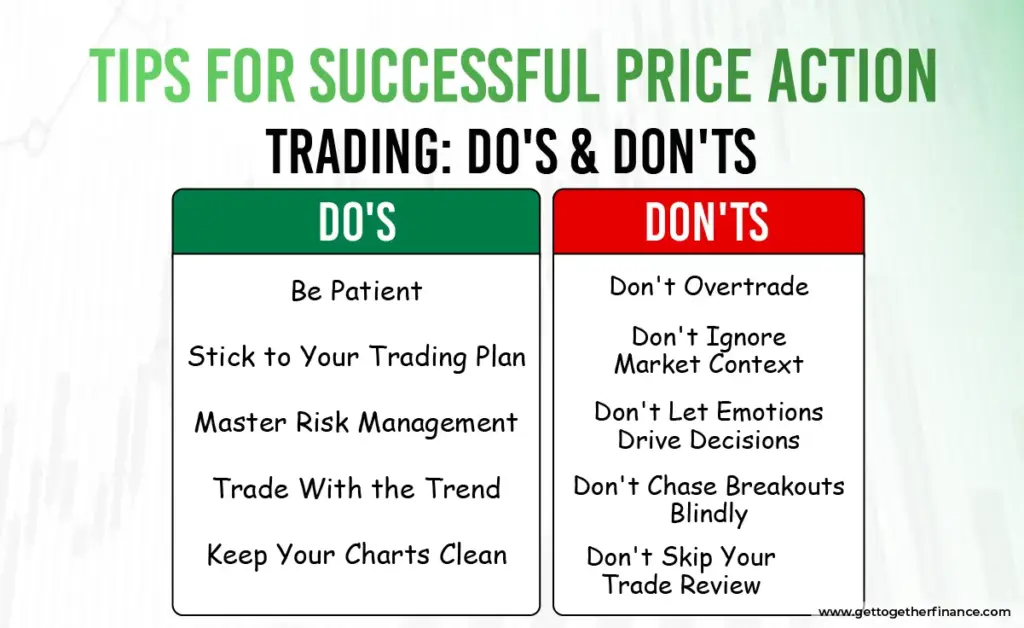
Knowing the right moves and the wrong ones can make all the difference in price action trading. Traders should keep in mind that successful price action trading takes more than just spotting patterns on a chart. Traders also need patience, discipline, and solid risk management to make well-informed decisions. Here are some important do’s and don’ts to keep in mind.
Do’s
Be Patient: Wait for high-probability setups to form rather than forcing trades. Price action rewards traders who let the market come to them.
Stick to Your Trading Plan: Discipline is everything. Define your entry, exit, and stop-loss levels before entering any trade and follow them consistently.
Master Risk Management: Always define how much you are willing to risk per trade. A good rule of thumb is to never risk more than 1–2% of your trading capital on a single position.
Trade With the Trend: The trend is your friend. Align your trades with the dominant market direction whenever possible for higher success rates.
Keep Your Charts Clean: Avoid cluttering your charts with too many indicators. Price action works best on clean, uncluttered charts where patterns are easy to spot.
Don’t s
Don’t Overtrade: Taking too many trades out of boredom or impatience is one of the biggest mistakes price action traders make. Quality always beats quantity.
Don’t Ignore Market Context: Never analyse a single candlestick or pattern in isolation. Always consider the broader trend and key levels before making a decision.
Don’t Let Emotions Drive Decisions: Fear and greed are the two biggest enemies of a price action trader. Stick to your system and avoid impulsive decisions.
Don’t Chase Breakouts Blindly: Always wait for a confirmed breakout with follow-through before entering. False breakouts are extremely common and can lead to unnecessary losses.
Don’t Skip Your Trade Review: Failing to review your past trades means missing out on valuable lessons. Regularly audit your trades to identify patterns in your mistakes and improve over time.
After covering the key practices, let’s now compare price action trading with indicator-based trading.
Price Action vs Indicator-Based Trading: Which is Better?
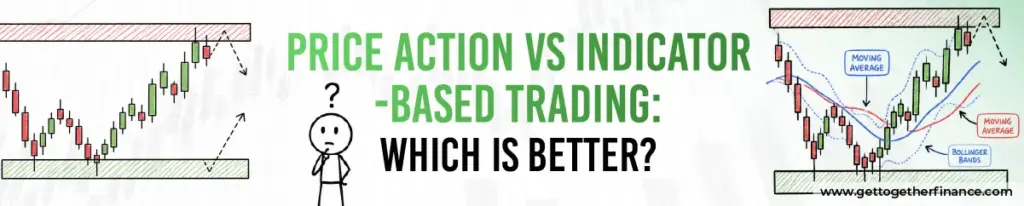
Price action and indicators are both common tools in technical analysis, but they look at the market in different ways. Price action focuses directly on price movements, while indicators rely on calculations based on market data. Let’s look at the key difference between them:
| Features | Price Action Trading | Indicator-Based Trading |
| Based on | Raw price movement | Mathematical formulas |
| Chart clutter | Clean and minimal | Multiple lines and signals |
| Speed | Real-time signals | Slightly delayed signals |
| Best for | Experienced traders | Beginners learning structure |
| Flexibility | Works in all markets | May need adjustments |
So which one is better?
Honestly, neither is perfect on its own. Price action gives you real-time, clean signals directly from the market. Indicators, on the other hand, are derived from past price data, which means they always lag slightly behind.
Traders can go with either approach, or combine both, depending on their trading style, experience, and goals. Beginners may find it helpful to understand both before deciding which one works better for them.
Now that we’ve compared price action and indicators, let’s look at how traders can pick suitable timeframes for applying price action analysis in Indian markets.
Best Timeframes for Price Action Trading in Indian Markets
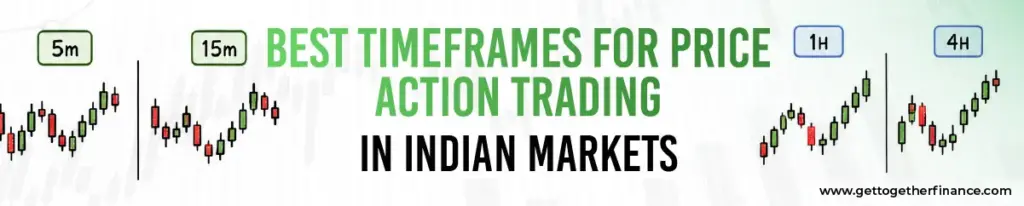
Different trading styles need different timeframes, so understanding how each one fits into the Indian market can help traders plan their trades more effectively. If you are trading in Indian markets like NSE or BSE, choosing the right timeframe can make a big difference. Here is a simple guide:
Short-Term / Intraday Traders (Buy and sell on the same day)
- 5-minute & 15-minute charts: Best for quick trades during market hours (9:15 AM to 3:30 PM IST)
- Most active windows are 9:15 AM – 11:00 AM and 1:30 PM – 3:00 PM
Swing Traders (Hold trades for a few days)
- 1-hour & 4-hour charts: Great for spotting trends without watching the screen all day
- Works well for traders who have a regular job alongside trading
Positional Traders (Hold trades for weeks or months)
- Daily & Weekly charts: Best for identifying big trends in Nifty, Bank Nifty, or individual stocks
- Requires less screen time and is less stressful
Quick Tip for Indian Traders: Always avoid trading in the first 5 minutes of market open (9:15 AM – 9:20 AM). Price action is very erratic during this window and can easily trap new traders.
After discussing how different timeframes can be used for price action trading, let’s look at some commonly used price action patterns.
Most Powerful Price Action Patterns You Must Know
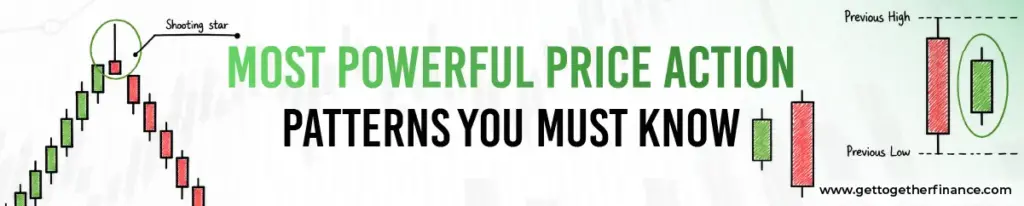
Price action patterns help traders understand how price behaves in different market situations. From reversals and breakouts to periods of consolidation, these patterns offer useful context when reading a chart. Let’s look at some commonly used price action patterns that traders should know.
1. Pin Bar (Hammer / Shooting Star)
A candle with a long tail and a small body. It shows that price tried to move in one direction but got rejected strongly. A pin bar at a key support or resistance level is one of the most powerful reversal signals.
2. Inside Bar
An inside bar is a candle that fits completely within the range of the previous candle. It signals that the market is taking a pause or consolidating. A breakout from an inside bar often leads to a strong move.
3. Engulfing Pattern
A large candle that completely covers the previous candle. A bullish engulfing at support means buyers are taking control. A bearish engulfing at resistance means sellers are stepping in.
4. Double Top & Double Bottom
Price hits the same level twice and fails to break through. A double top signals a potential fall. A double bottom signals a potential rise. Simple, clean, and extremely reliable.
5. Head and Shoulders
A three-peak pattern where the middle peak is the highest. It is one of the most well-known reversal patterns and signals that an uptrend may be coming to an end.
6. False Breakout (Fakeout)
Price breaks above a key level but quickly reverses back. Smart traders watch for these traps and trade in the opposite direction once the fakeout is confirmed.
Key Takeaways: Price Action Trading Summary
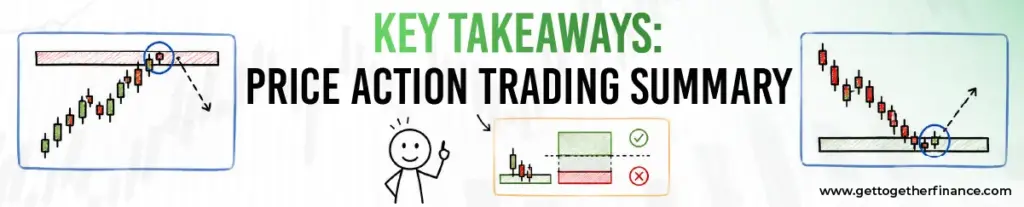
Price action in trading is a useful approach that enables traders to analyze price movements on charts to make informed decisions. Traders can better understand market behaviour by utilizing appropriate tools, employing appropriate strategies, and comprehending key principles. However, to develop consistency with price action, patience, risk management, and ongoing skill development are essential.
By understanding concepts such as support and resistance, candlestick patterns, trends, breakouts, and chart patterns, traders can analyse price movements more effectively. Picking the right timeframe and following a solid trading plan can also help you make smarter decisions while keeping risk in check across different market conditions.



