
Trading Expectancy Explained: The Formula That Tells You Whether a Strategy Works
- Updated on :
- 4 Views
- by Charul Shakya

 Instagram
 Linkedin
After winning a few trades, a trading approach can look impressive. But does it really prove that the strategy works? Not necessarily.
A high win rate by itself isn’t enough to judge an approach. You also need to look at your average profit on winning trades and your average loss on losing trades. That is where trading expectancy proves its worth.
Trading expectancy brings these factors together to give you an estimate of the average profit or loss you can expect per trade, over a series of trades. In simple words, it helps you check if a strategy’s numbers actually give it an advantage over time.
What Is Trading Expectancy?

Trading expectancy is a number that shows, based on past results, how much profit or loss an approach makes on average per trade. It helps traders check whether a strategy has had an overall advantage or disadvantage across multiple trades.
Trading Expectancy takes into account four things:
- How frequently the strategy wins
- How frequently it falls short
- How much it earns on winning trades
- How much it costs on losing trades
For example, a trading approach might win only 40% of the time but still make money overall, as long as its winning trades are much bigger than its losing trades. That’s why judging an approach by win rate alone can mislead you.
Trading expectancy can’t tell you if your next single trade will win or lose. Instead, it shows whether a strategy has a real edge, based on its overall numbers across many trades
Trading Expectancy Formula

The basic trading expectancy formula is:
Trading Expectancy = (Win Rate × Average Win) − (Loss Rate × Average Loss)
For example, assume a trading approach has:
- Win rate = 50%
- Loss rate = 50%
- Average win = ₹2,000
- Average loss = ₹1,000
The calculation would be:
(0.50 × ₹2,000) − (0.50 × ₹1,000) = ₹500
So, the trading expectancy is ₹500 per trade.
This doesn’t mean the trader earns ₹500 on every single trade. Some trades might make ₹2,000; others might lose ₹1,000. The ₹500 is just the average outcome you’d expect across many trades.
Expectancy Formula Using Win Rate
You can also calculate trading expectancy just by knowing the win rate, since the loss rate can be figured out from it.
Since: Loss Rate = 1 − Win Rate
The formula becomes:
Trading Expectancy = (Win Rate × Average Win) − [(1 − Win Rate) × Average Loss]
For example:
- Win rate = 60%
- Average win = ₹1,500
- Average loss = ₹1,000
Therefore: (0.60 × ₹1,500) − (0.40 × ₹1,000) = ₹500
Based on these numbers, the strategy has a positive expectancy; it earns ₹500 per trade on average.
Average Win and Average Loss
Your average win is simply the average amount you earn on winning trades.
Average Win = Total Profit from Winning Trades ÷ Number of Winning Trades
Your average loss is simply the average amount you lose on trades.
Average Loss = Total Loss from Losing Trades ÷ Number of Losing Trades
For example, if five winning trades produce a total profit of ₹10,000:
₹10,000 ÷ 5 = ₹2,000 average win
If five losing trades produce a total loss of ₹5,000:
₹5,000 ÷ 5 = ₹1,000 average loss
When you put the loss into the expectancy formula, consider it as a positive number.
What Each Variable Means
A few important numbers from your past trades drive trading expectancy. Each number tells you something different and helps you understand how frequently you win, how much you profit, and how much you lose per losing trade.
| Variable | What it tells you |
| Win Rate | How often your trades turn out profitable |
| Loss Rate | How often your trades end up losing money |
| Average Win | What you typically earn on your winning trades |
| Average Loss | What you typically lose on your losing trades |
| Trading Expectancy | What you can expect to earn or lose, on average, per trade |
How to Calculate Trading Expectancy Step by Step

In order to find your trading expectancy, you don’t need complicated calculations. If you keep a proper trading journal, most of the information you need is already there.
Step 1: Calculate Your Win Rate
The first step is to find out how many trades were profitable.
Use: Win Rate = Winning Trades ÷ Total Trades × 100
Let’s say you made 100 trades, and 55 of them made a profit.
So, your win rate = 55 ÷ 100 × 100 = 55% ,
And the loss rate = 45%
Step 2: Calculate Your Average Winning Trade
In this, you need to add the profits from all your winning trades and divide the total by the number of winning trades.
Let’s say your 55 winning trades earned ₹110,000 in total profit.
₹110,000 ÷ 55 = ₹2,000
Your average winning trade is ₹2,000.
Step 3: Calculate Your Average Losing Trade
Now, let’s calculate the average loss from your losing trades.
Let’s say your 45 losing trades led to a total loss of ₹67,500.
₹67,500 ÷ 45 = ₹1,500
Your average losing trade is ₹1,500.
Step 4: Apply the Expectancy Formula
Now put all four numbers into the formula:
Trading Expectancy = (0.55 × ₹2,000) − (0.45 × ₹1,500)
= ₹1,100 − ₹675
= ₹425
Your trading expectancy is ₹425 per trade.
Step 5: Interpret the Result
A positive expectancy of ₹425 means that, on average, each trade in this sample made a profit of ₹425. This doesn’t mean the very next trade will earn exactly ₹425. Even if your strategy has positive expectancy, you can still lose money several times in a row. But it’s normal and doesn’t mean the trading approach is weak.
What Does Positive Trading Expectancy Mean?

Positive trading expectancy means a strategy earns a profit on average across many trades. Suppose a trading approach has:
- Win rate = 50%
- Average win = ₹2,000
- Average loss = ₹1,000
Expectancy = (0.50 × ₹2,000) − (0.50 × ₹1,000) = ₹500
This approach has positive expectancy because its average wins are bigger than its average losses.
However, positive expectancy doesn’t mean every single trade will win. An approach can still face losses, or consecutive losses, and still have a positive expectancy overall. What really matters is whether the strategy stays positive across enough trades and in different types of markets. By looking at the results this way, you can more clearly see how it has performed over time.
What Does Negative Trading Expectancy Mean?
Negative trading expectancy means a strategy loses money on average per trade, across the trades used in the calculation. Now let’s look at a trading approach with:
- Win rate = 40%
- Average win = ₹1,000
- Average loss = ₹2,000
Expectancy = (0.40 × ₹1,000) − (0.60 × ₹2,000) = -₹800
This negative result means the strategy loses about ₹800 per trade on average.
But a negative expectancy doesn’t mean the approach can never work. It may highlight those areas that need fixing, like trade selection, average losses, exit decisions, or execution. Traders should first check what’s causing the negative result, instead of just increasing the number or size of trades. By understanding these factors, they can decide whether the trading approach needs changes before using it on more trades.
What Is a Good Trading Expectancy?

No single trading expectancy can be called good for every trader or strategy. If a trading approach has a ₹500 expectancy, it may look better than one with ₹200. But those numbers don’t tell you much on their own. A strategy with ₹500 expectancy that takes 5 trades a month can give very different results from one with ₹200 expectancy that takes 50 trades.
Also, capital, risk per trade, trading costs, sample size, and consistency play an important role. So instead of focusing on one specific number, check two things. First, does your trading approach stay positive after costs? Second, can you follow it within your risk limits? This gives you a more practical way to check how your approach is performing.
Trading Expectancy vs. Win Rate

Win rate tells you how often trades win, but not how much money you actually make or lose on them. While, trading expectancy considers both: how often you win and lose, along with how big those wins and losses are. This offers you a broader view of how the approach is performing.
Why a High Win Rate Can Still Lose Money
A strategy might win 80 out of 100 trades, which gives it an 80% win rate. But if each win earns only ₹200, while each loss costs ₹1,500, the losses from just 20 trades can outweigh all the gains from the 80 wins.
Why a Low Win Rate Can Still Be Profitable
The reverse can also happen. A strategy might win only 40% of its trades but still stay profitable if its average win is much bigger than its average loss. For example, you earn ₹3,000 on a winning trade but lose only ₹1,000 on a losing trade. In this case, the bigger wins can cover a lower win rate.
Here, the key takeaway is that winning more often isn’t the only thing that determines whether a strategy is profitable.
Trading Expectancy vs. Risk-Reward Ratio

The risk-reward ratio compares how much risk you’re willing to take against the potential reward from a trade. For example, a 1:2 risk-reward ratio means you risk ₹1 to make ₹2. Trading expectancy gives a bigger-picture view of a strategy. It takes into account the real win rate, along with the average profit and average loss over many trades.
We may plan a strategy around a 1:2 risk-reward ratio, but that doesn’t guarantee every trade will hit that mark. Some trades may hit the stop-loss, while others get closed early or don’t generate the planned profit. Therefore, the actual average profit and loss differs from the original risk-reward plan.
Trading Expectancy vs. Profit Factor

Both trading expectancy and profit factor are useful for evaluating your trading approach, but they measure performance in different ways. Trading expectancy shows the average result of each trade, whereas profit factor measures total gross profits against total gross losses.
What Each Metric Measures
Trading expectancy shows the average profit or loss per trade, based on three factors: its win rate, average win, and average loss.
Profit factor is calculated as:
Profit Factor = Gross Profit ÷ Gross Loss
For example, if gross profits are ₹2,00,000 and gross losses are ₹1,00,000, the profit factor is 2.0.
When to Use Each Metric
Expectancy shows the average result per trade, while profit factor shows how total profits compare to total losses. In order to evaluate completely, you can use both metrics to understand different aspects of your strategy’s performance. It gives you a broader view of how a strategy has performed historically.
How Many Trades Do You Need to Calculate Expectancy Reliably?

There’s no exact number of trades that guarantees a reliable trading expectancy calculation. A strategy based on only 5 or 10 trades might look profitable, but that could just be because of a short winning streak or a few lucky trades.
When you collect more trades, you get a better idea of how the approach works in different market conditions. So instead of focusing on a fixed number, collect enough trades to better understand how your approach performs over time. Also, it helps you to keep an eye on your trading expectancy as you take more trades.
Trading Expectancy and Position Sizing

Trading expectancy tells you the average reTRsult a strategy has produced across many trades. Position sizing is about deciding how much capital you risk on each trade. These two concepts are different, but complement each other.
If you’re trading with too large a position size, even an approach with positive expectancy can lead to major losses. For instance, if a trader puts too much capital at risk on each trade, a few consecutive losses can sharply reduce their overall capital. That’s why it’s important to think about expectancy alongside a sound position-sizing and risk-management plan.
How Fees, Slippage, and Execution Affect Expectancy
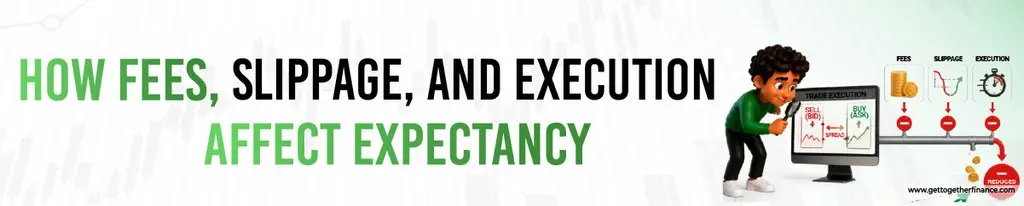
The trading expectancy that you calculated might be different from what you actually see in your trading account. Costs like brokerage, taxes, exchange charges, and slippage can reduce your actual returns. For instance, let’s say your strategy earns ₹300 per trade before costs, but you spend around ₹100 per trade on costs. After subtracting these costs, your real expectancy drops to about ₹200 per trade.
But trading costs aren’t the only factor that can affect your actual expectancy. In this, your execution also plays an important role. If you enter a trade late, exit early, or adjust your stop-loss, it can impact both your average win and average loss. That’s why it’s better to calculate expectancy from your real trade results, not with the idealised targets, to see how your strategy is performing.
How to Improve Your Trading Expectancy

You can improve trading expectancy by improving your win rate, average win, average loss, trade selection, and overall trading discipline. By checking your trading journal, you can figure out what’s impacting your results and where improvements are needed.
Increase Average Win
First, review your winning trades and see whether you’re closing too early or missing out on a bigger part of the move. Also, if your trading rules allow you to hold longer, a better exit strategy could increase your average win. You need to avoid holding trades longer without any plan. First, check whether they genuinely improve your results or not.
Reduce Average Loss
Both improving average wins and reducing unnecessary losses can help improve your overall trading expectancy. You need to check whether your losing trades could have been avoided. Also, check for mistakes like holding onto a losing trade without a clear plan, taking trades that don’t follow your trading rules, or moving your stop-loss further away.
Improve Trade Selection
The more you become selective with your trades, the more your results will improve. Always go through your trading journal to identify when and where your approach tends to work best. You may find that specific setups or market conditions have consistently worked better in the past, and by focusing on that, you can reduce lower-quality trades.
Reduce Unnecessary Trades
In trading, it’s also important to know when not to take a trade. You need to understand that more trades don’t automatically create more profit opportunities. When you take trades simply because the market is moving, or because you feel the need to stay active, can only add low-quality trades to your results. In some cases, expectancy can improve by doing less and waiting for setups that meet your trading rules.
Common Mistakes When Calculating Trading Expectancy

The reliability of your trading expectancy depends entirely on using good data. If the trading data is incomplete or the numbers are calculated incorrectly, even a basic calculation can mislead you. By understanding these common mistakes, you are better able to evaluate your approach more accurately.
Here are some common mistakes:
- Not including trading costs
- Relying on expected profits rather than actual profits
- Merging different trading approaches into a single number
- Not including losing trades in the calculation
- Assuming a positive expectancy means future profits are certain
- Adjusting trading rules during the analysis
- Miscalculating average win or average loss
- Calculating expectancy based on a small number of trades
Another common mistake is focusing only on the final expectancy number, without checking what contributed to it. That’s why you need to always review the trades to understand how the approach reached that result.
Conclusion
Trading expectancy doesn’t show you the outcome of your next trade. Instead, it helps you check whether your trading approach has worked well over many trades. The real value comes from looking at all your results together, not just a few good or bad trades. When you calculate trading expectancy from reliable data and review it regularly, it becomes a useful part of your trading review process. It helps you go beyond tracking single trades, so you can see how your approach has performed overall, over time.
FAQs

Is positive trading expectancy guaranteed profit?
No, positive expectancy doesn’t guarantee future profits. It just shows the average result of past trades, and can change as the market and trading habits shift.
What is the difference between trading expectancy and win rate?
Win rate shows the percentage of winning trades, while expectancy looks at both wins and losses, and their size, to find the average outcome per trade.
Should trading costs be included in trading expectancy?
Yes, when you include brokerage, taxes, slippage, and other costs, you get a more realistic view of your strategy’s true expectancy.
How can I improve my trading expectancy?
You can improve your expectancy by executing better trades, earning bigger wins, cutting down losses, picking better trades, and skipping unnecessary trades.
Is trading expectancy better than profit factor?
No, neither is better. Expectancy shows the average result per trade, while profit factor compares total profits to total losses. By using both metrics together, you can get a complete view of how a strategy performs.



