Evening Star Pattern: A Complete Guide to Spotting Bearish Reversals
- Updated on : May 18, 2026
- 4782 Views
- by Arun Singh Tanwar

 Facebook
 Instagram
 Youtube
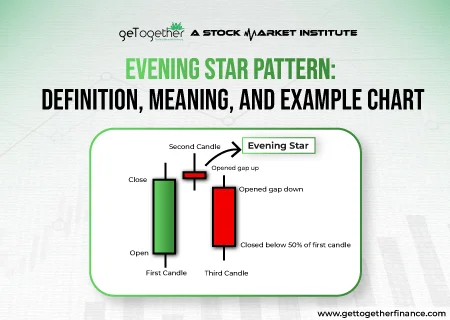
In the ever-shifting tides of stock markets, where success hinges on astute analysis and timely decision-making, candlestick patterns are an instrumental financial tool for traders and analysts alike.
Among these, the evening star pattern stands out as a powerful visual cue for potential trend reversals in the market. Comprising three distinctive candlesticks, this chart pattern takes shape amidst an established price uptrend, signaling a pivotal shift in market sentiment.
This comprehensive guide will take you through the evening star candlestick pattern, exploring its formation, significance, and practical trading tips.
The evening star pattern is a three-candle pattern that technical analysts use to analyze stock price charts. It is a bearish signal and suggests a potential trend reversal from bullish to bearish. In other words, an evening star candlestick pattern reflects a shift in sentiment from buying to selling, and traders interpret it as an opportunity to sell or take short positions.
Evening star candle patterns are associated with the top of a stock price uptrend, indicating that the uptrend is nearing its end, laying the foundation for the downtrend. Traders often use trendlines and price oscillators to identify it accurately and confirm whether an evening star pattern has occurred.
Variations of the Evening Star Pattern
Here are some major variations in the evening star candlestick pattern:
1. Classic Evening Star
- First candle: Long bullish (green) candle represents a strong buying pattern.
- Second candle: A short candle (can be bearish or bullish) indicates uncertainty.
- Third candle: Long bearish (red) candle closes deep inside the first candle’s body.
Signifies: The uptrend is weakening, and sellers are taking control over the market.
2. Evening Doji Star
- It is similar to the classical pattern, but a middle candle is a Doji which means the opening and closing prices are the same.
- The Doji indicates lower buying momentum and strong uncertainty.
Signifies: It is a stronger reversal indication than the classical candlestick pattern because Doji outlines the change in sentiment and market uncertainty.
3. Bearish Abundant Baby
- The middle candle (Doji or small one) opens higher than both the first and third candles.
- The Doji does not overlap the candle on both sides.
Signifies– An unusual but powerful bearish reversal that presents a failed continuation of bullish momentum.
4. Evening Star with Gap Down Confirmation
- It is similar to the classical pattern, but the third candle opens lower than the middle candle’s low.
- The gap down makes the indication powerful.
Signifies-The gap down provides a strong bearish sign, which shows selling pressure.
5. Modified Evening Star (with small third candle)
- The first two candles are normal, but the third red candle is smaller than usual.
- The closing price might not go deep into the first candle’s body.
Signifies a less powerful reversal that is mainly followed by sideways movement before a major trend shift.
6. Evening Star with Volume Confirmation
This pattern is just like the classic one, but volume adds extra confirmation.
- First candle- High volume (buying momentum).
- Second candle- Decreasing volume (uncertainty).
- Third candle- Increasing volume (selling pressure).
Signifies– High accuracy of the pattern, which indicates that the power has shifted from buyers to sellers.
“The Evening Star is a three-candle pattern that forms at the end of an uptrend. It signifies that buyers are losing momentum and sellers are entering the market with confidence,”- Capital.com.
How an Evening Star Works?
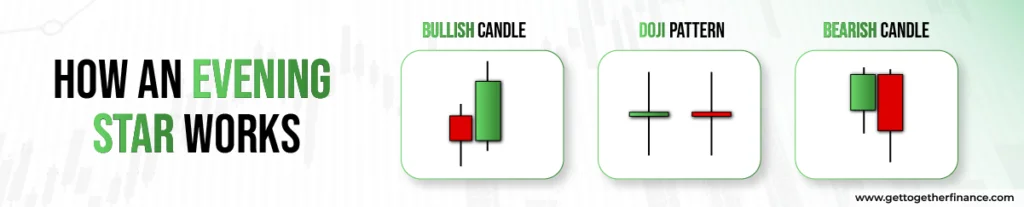
The evening star pattern forms over three days. Here is the breakdown of how it unfolds:
First Candle (Day 1 – Bullish Candle)
The pattern starts with a well-established uptrend, signifying that buyers are in control of the stock market. On the first day, a large bullish candle forms, representing consistent buying pressure. This candle indicates the optimism and strength of the bulls.
Second Candle (Day 2 – Doji or Small Body)
The second day introduces uncertainty in the market. This is represented by a small-bodied candle, a Doji, or a candle with an opening and closing price significantly close to each other. This second candle is the “star.”
The small body or Doji signals that the purchasing momentum from the first day is slowing down. It reflects a potential shift in sentiment, as neither buyers nor sellers are dominating the bourses on this day.
An ideal evening star candlestick pattern is characterized by a gap up from the first candle to the star. It means that the opening price surged swiftly from the preceding closing price, with very few or even no trades happening in between.
Also Read: Pennant Pattern
Third Candle (Day 3 – Bearish Candle)
The third day completes the pattern with a large bearish candle, indicating a strong shift in sentiment. Usually, with a gap down from the preceding star, this candle opens lower than the previous day’s close and closes well into the first day’s bullish candle.
The large bearish candle suggests that sellers have gained control, overpowering the purchasing pressure seen in the previous days. This change in momentum is a bearish reversal signal, confirming the evening star pattern and giving a sell call.
Furthermore, the shadow or wick is the lines above and below a candle body and represents the highest and lowest stock prices during a specific period. A longer shadow suggests greater price volatility, and vice versa. While identifying an evening star candlestick pattern, analysts and traders focus more on the open and close prices instead of the trading range of that session.
How To Identify An Evening Star Pattern?

To identify an evening star candle pattern, you should observe the characteristics of three consecutive candlesticks on a stock price chart. Here is a step-by-step guide on how you can recognize the three-legged pattern:
Locate the Uptrend
Start by analyzing the overall trend of the stock’s price movement. The evening star pattern usually forms during an established uptrend. As such, look for a series of highs or higher lows (green) on the stock price chart, indicating a bullish market.
Find the First Candle
Look for a large bullish candle (green) with a long, hollow body representing strong purchasing pressure. This candle confirms the existing price uptrend. The open and close prices should have a notable gap, representing a significant price increase.
Identify the Second Candle
Following the large bullish candle, you should see a Doji or small-bodied candlestick. This candle’s closing price should ideally be within the range of the first candle’s body, indicating indecision and weakening buying pressure.
Confirm the Bearish Reversal
Finally, look for a strong bearish candle (red) closing considerably below the second candle’s low. This candle should have a long, filled body, emphasizing the selling pressure and confirming the trend reversal.
Timeframe & Market Asset Type Effects
Timeframe Effects
The timeframe traders trade on (such as minute, hourly, daily, or weekly charts) decides how they understand chart patterns and price movements. There are 3 types of timeframes, which include:
1. Short-Term Timeframe (Intraday / 1-min to 15-min)
- Record a small price variation on the same day.
- Patterns form fast and may give wrong indications because of market noise.
- Best for day traders or scalpers.
- Need fast decision-making and risk management.
- Example- On a 5-minute chart, an evening star may present a small pullback, not a complete trend shift.
2. Medium-Term Timeframe (Hourly/ Daily)
- Provide a balance between accuracy and detail.
- Less wrong indication as compared to shorter charts.
- Usually utilized by swing traders.
- Patterns are fairly powerful and last up to weeks.
- Example- On a daily chart, a head and shoulder chart indicates a trend shift that lasts numerous days.
3. Long-Term Timeframe
- Analyse market shifts and investors’ sentiment
- Patterns are highly accurate and show powerful reversals.
- Best for long-term investors and positional traders.
- Fewer traders, but each has full confidence.
- Example- On a weekly chart, a double bottom might indicate the beginning of a long-term uptrend.
Market Asset Type Effect
Different assets act differently because of trading hours, volatility, and liquidity. These asset types include:
1.Stocks
- Show ownership in companies.
- Affected by: news, investors’ sentiments, economic growth, and company earnings.
- Impact: High volatility and scope for better earnings.
2. Bonds
- Are loans to corporations or the government.
- Affected by: credit rating, inflation, and interest rates.
- Impact: Usually safer but with fewer returns: price may go down when interest rates go up.
3. Commodities
- Comprising gold, oil, silver, etc.
- Affected by: demand-supply changes, inflation, and geopolitical events.
- Impact: Commonly increases when inflation increases.
4. Real Estate/ REITs
- Shows real estate investment and property.
- Affected by: economic health, interest rates, and demand.
- Impact: Offer inflation protection and a stable income.
“The Evening Star pattern is a reliable signal of a market top and assists traders in marking good points to sell”-StoxBox.
How to Trade Evening Star Patterns with Examples
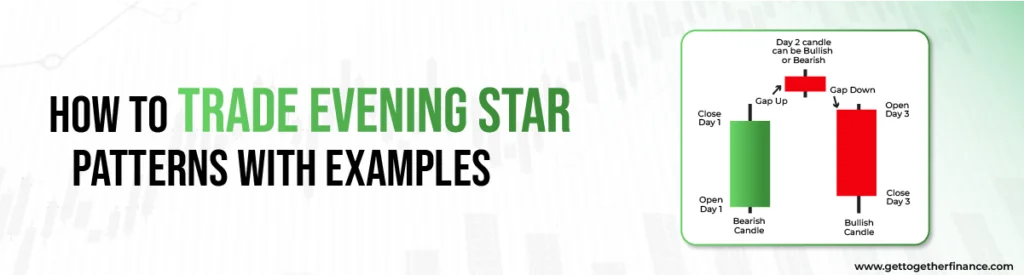
Follow these steps to trade stocks using an evening star pattern:
- Confirmation entry: Wait for the bearish candle (third candle) to close before entering a short position. Higher volume lends additional credibility to the potential trend reversal. This confirmation minimizes false signals and increases confidence in the downtrend.
- Entry point: Enter short positions after the third candle closes or a confirmation signal from another indicator, looking for targets at previous support levels or defined risk-reward ratios.
- Stop-loss orders: Place a stop-loss order above the high of the evening Doji candle (Day 2) to limit potential losses if the pattern fails.
- Take-profit levels: Set take-profit targets based on support levels or the extent of the expected price reversal. Fibonacci retracement levels and prior swing lows can act as potential profit-taking points.
This example shows a clear evening star pattern followed by a significant downtrend. The high volume on the bearish candle confirms the selling pressure.
Additional Tips for Accurate Identification:
- Look for volume confirmation. Ideally, the volume should be lower on the first candle (strong buying) and higher on the third candle (strong selling). This supports the pattern’s validity.
- Consider the location of the pattern. Ideally, it should appear near a resistance level or after a sustained uptrend, increasing its potential reliability.
Evening Star vs Other Bearish Reversal Patterns
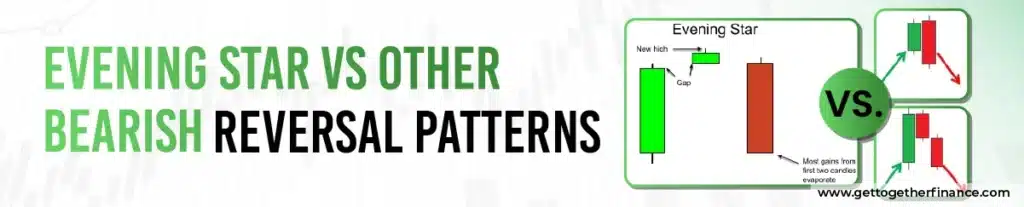
Let’s now understand the differences with a table:
| Pattern | Number of Candles | Structure | Signal | Strength | Confirmation Needed | Impact |
| Evening Star | 3 | Bullish candle- Small indecisive candle-Strong bearish candle. | Indicates a shift in control from buyers to sellers. | Moderate to Strong. | Yes, follow through bearish candles. | Evening star patterns generally indicate the beginning of a short-to-medium term decrease in price. |
| Shooting Star | 1 | Small body with long upper shadow. | Signifies a possible trend reversal as buying pressure starts to weaken. | Moderate | Yes, the next candle has to close lower. | Commonly results in a slight downturn in price. |
| Bearish Engulfing | 2 | A strong bearish candle fully covers the previous bullish candle. | Indicate selling pressure and strong bearish reversal. | Strong | Helpful but not majorly needed. | May result in sudden or strong decrease in price. |
| Dark Cloud Cover | 2 | After a bullish candle, a bearish candle forms and ends below the middle of the previous candle. | Signal trend reversal and reduced buying strength. | Moderate | Yes, the next candle should confirm the movement. | Commonly lead to slight decline or change in price. |
| Hanging Man | 1 | A small candle with a long lower wick showing near the peak of an uptrend. | Indicate a potential shift in trend as sellers start to acquire strength. | Weak to Moderate. | Yes, the following bearish candle confirms the reversal. | May cause short term weakness. |
Strength and Weakness of Evening Star Pattern
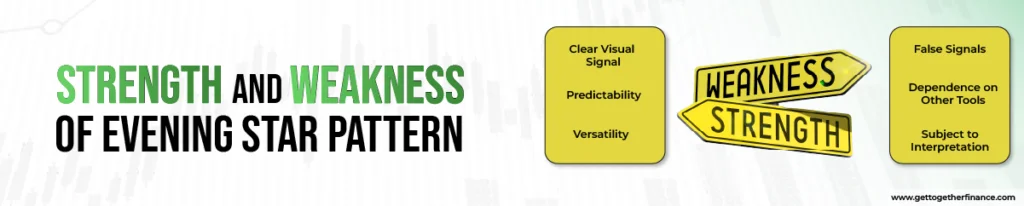
The evening star candlestick pattern has both strengths and weaknesses that you must carefully consider when including it in your decision-making.
Strengths
- Clear Visual Signal: The pattern’s three-candle structure offers a clear and visually recognizable signal on stock price charts. This simplicity will help you make quicker assessments.
- Predictability: When formed correctly, the evening star pattern has a relatively high success rate in predicting bearish reversals, especially when appearing near resistance levels or after extended uptrends. That way, you can anticipate downward stock price movements and potentially adjust your positions accordingly.
- Versatility: You can apply the evening star pattern to multiple time frames, from short-term intraday charts to long-term monthly charts. This versatility makes it adaptable to numerous trading styles and strategies.
Weaknesses
- False Signals: Like many technical indicators, the evening star candle pattern can produce false signals. Market conditions, news events, or other factors can impact stock price movements and disrupt the pattern’s accuracy.
- Dependence on Other Tools: You cannot predict stock price movements solely using the evening star pattern. Instead, you should combine it with other technical indicators, such as moving averages or volume analysis, to improve its reliability and reduce the risk of false signals.
- Subject to Interpretation: Interpreting the evening star candlestick pattern may vary among traders. The size of the candles, the definition of a Doji, and the strength of the bearish confirmation candle leave room for different analyses, leading to varied conclusions about the pattern’s significance.
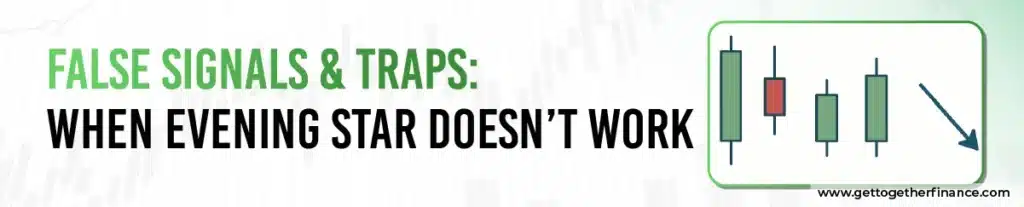
False Signals & Traps: When Evening Star Doesn’t Work
Although, evening star candlestick pattern is a bearish reversal pattern, sometimes, it gives a false signal because of the following reasons:
| Cause of False Signal | Explanation | Impact |
| Lack of Confirmation Signal | If the confirming bearish candle does not appear then the reversal indication remains uncertain. | The market may consolidate but continues to uptrend again. |
| Strong Uptrend Momentum | In a powerful bullish trend, a single reversal pattern fails to change direction. | The pattern forms but buyers take power to control. |
| News or Event Impact | Favourable news or powerful learning outcomes can outweigh technical patterns. | In spite of a bearish pattern, the price goes up. |
| Low Timeframe Noise | On lower time frames (5-15 min charts), market fluctuations can form patterns that look real but are not. | Generally give false signals to intraday traders. |
| Weak Volume | If the bearish candle forms with low trading volume then it does not show real selling pressure. | Price drops for a short time but continues to start rising. |
| Formed at Wrong Market Level | If the pattern forms mid-trend rather than resistance then it becomes less reliable. | Result to false sell indication. |
Pro Tip: To avoid traps, always confirm the Evening Star candle pattern with:
- A close below support or the previous candle’s low.
- High volume on the bearish candle.
- Indicators such as moving average crossover and RSI divergence.
Sharpen your Technical Analysis

The evening star candlestick pattern is a crucial guide for stock traders and analysts in decoding substantial price shifts. Through its distinctive three-candlestick formation, this bearish reversal pattern offers a clear visual narrative of shifting market sentiments.
By understanding the interplay of bullish and bearish forces this pattern showcases, you can make well-informed decisions and keep pace with the ever-shifting dynamics of stock markets.
That said, you should experiment with multiple strategies and indicators to find what works best for you. Moreover, remember that the evening star is not a foolproof indicator. Better combine it with other technical analysis tools like moving averages, indicators, and chart patterns to see a more holistic view of the market.
FAQ
1. What is the evening star pattern?
The evening star pattern is a stock price chart formation that suggests that the uptrend is losing steam, and a price decline is likely. A bearish candlestick pattern, it consists of three candles: an uptrend, a small-bodied candle signaling indecision, and a bearish candle confirming a potential trend reversal. Traders use it as a signal to sell or take a more defensive position.
2. How is the evening star pattern different from other patterns?
Firstly, the evening star pattern uses three candlesticks (there are pretty few), while most other patterns use one or two.
Secondly, each candle in the evening star pattern has specific size and position requirements, making it more objectively identifiable than open-ended patterns.
Lastly, given its complexity, the evening star pattern occurs less frequently than many other candlestick patterns.
3. What is the significance of the evening star for traders?
The evening star pattern signals a potential reversal from an uptrend to a downtrend. While less prevalent than other candlestick patterns, its specific requirements often result in a stronger, more reliable signal when it shows up on the trading chart. Even though the evening star pattern is not foolproof, it offers valuable support for identifying potential turning points, especially when used with other indicators.
4. Are there any variations or interpretations of the evening star?
The most common variation of the evening star is the Doji evening star pattern. In this candlestick pattern, the second component is a Doji candle, where the open, high, low, and close are almost equal. This underlines a strong sense of indecision before the reversal. On the contrary, the evening star pattern has a small-bodied second candle, indicating some indecision or a potential stall in the uptrend.
5. What is the reliability of the evening star in predictions?
The reliability of the evening star pattern depends on multiple factors, including the overall market sentiment, the strength of the trend, and confirmation from other technical indicators. While the evening star represents a bearish reversal, its effectiveness can vary. You must use it alongside other analysis tools for a more holistic and reliable view.
6. When is the evening star pattern most effective?
The evening star pattern is most effective when it appears after a sustained uptrend, indicating a potential trend reversal. Its reliability increases when accompanied by higher trading volumes and confirmation from other technical indicators, such as oscillators or trendlines. Traders find the evening star more compelling when it appears at significant resistance levels or aligns with broader market conditions, suggesting a sentiment shift.


