Flag Chart Pattern: Meaning, Types & Breakout Tips
- Updated on : January 7, 2026
- 7058 Views
- by Arun Singh Tanwar

 Facebook
 Instagram
 Youtube
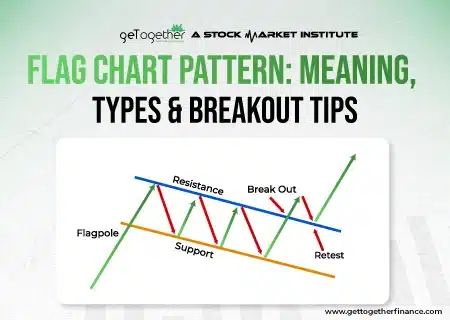
Overview
The Flag pattern in the stock market is like the calm before the storm. Take it as a momentary pause in the non-stop tide of price movement. In this blog, we are going to reveal the path of how to predict and use the price movement direction in your favor.
Now this is one more pattern in the series of patterns that you may have learned in technical analysis while trading stocks in your stock market journey. The flag pattern can be a short-term powerful, money-making pattern if you use it correctly. So let’s take a dive to understand what this fuss is all about.
What is a Flag Pattern?
The flag pattern is one of the most famous technical analysis patterns that help traders identify potential trend continuation. This pattern is pretty easy to understand as the name itself suggests, it resembles a flagpole and a flag.
Let’s make it a bit simple, the flag pattern without the flagpole is a rectangle pattern. The rectangle pattern consists same parallel trend lines and price fluctuation as the flag pattern which is also known as the consolidation phase.
The main function of a flag pattern is to signal the continuation of the trend after a pause. It gives a window to the traders to take entry who missed it in the previous move.
It allows traders to take entry into the market in the middle of the trend and to enjoy the remaining rally. Just like a train if you miss boarding it at one station you can catch it at another station.
But don’t forget it is not that simple, running to another station means driving fast and that leads to high chances of mis-happening, The same applies here, you should be well-versed with the knowledge of technical analysis along with demand and supply theory. It will help you in making your research and analysis more reliable and accurate.
Now there are two types of flag patterns. Although their work is the same let’s get to know the differences.
Bullish Flag Pattern
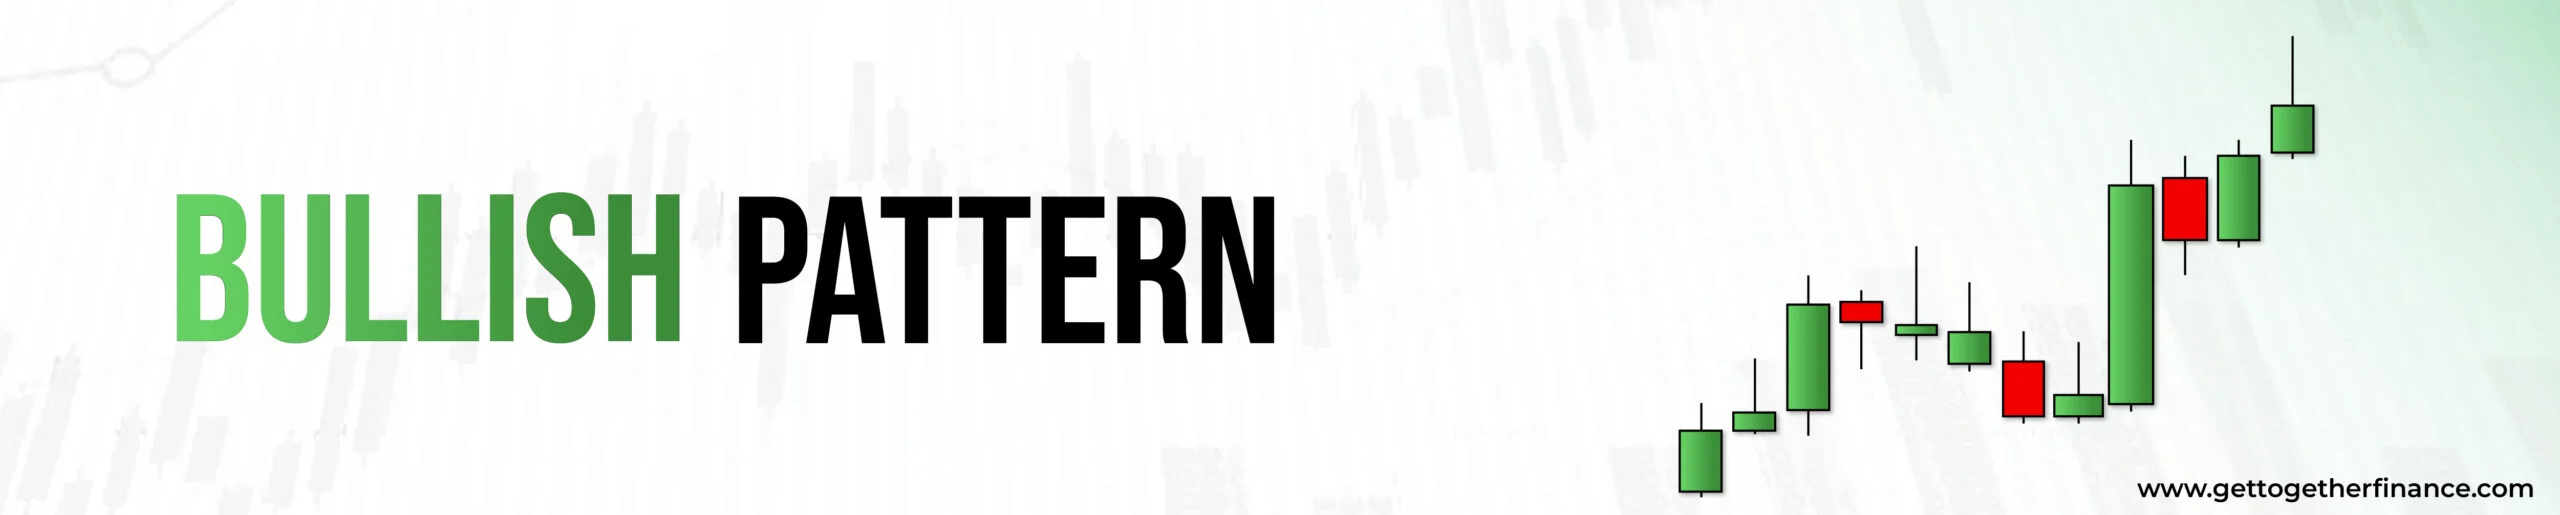
The bullish flag pattern is signalled with the formation of the flagpole, with a strong up move in the price. After the strong up move, a consolidation phase takes place in a parallel channel majorly in the opposite direction of the flagpole which makes up the flag. This indicates a temporary pause after an uptrend this signals traders the potential of the trend continuation. The bullish signal is confirmed when the price breaks up the upper parallel line of the flag.
Bearish Flag Pattern
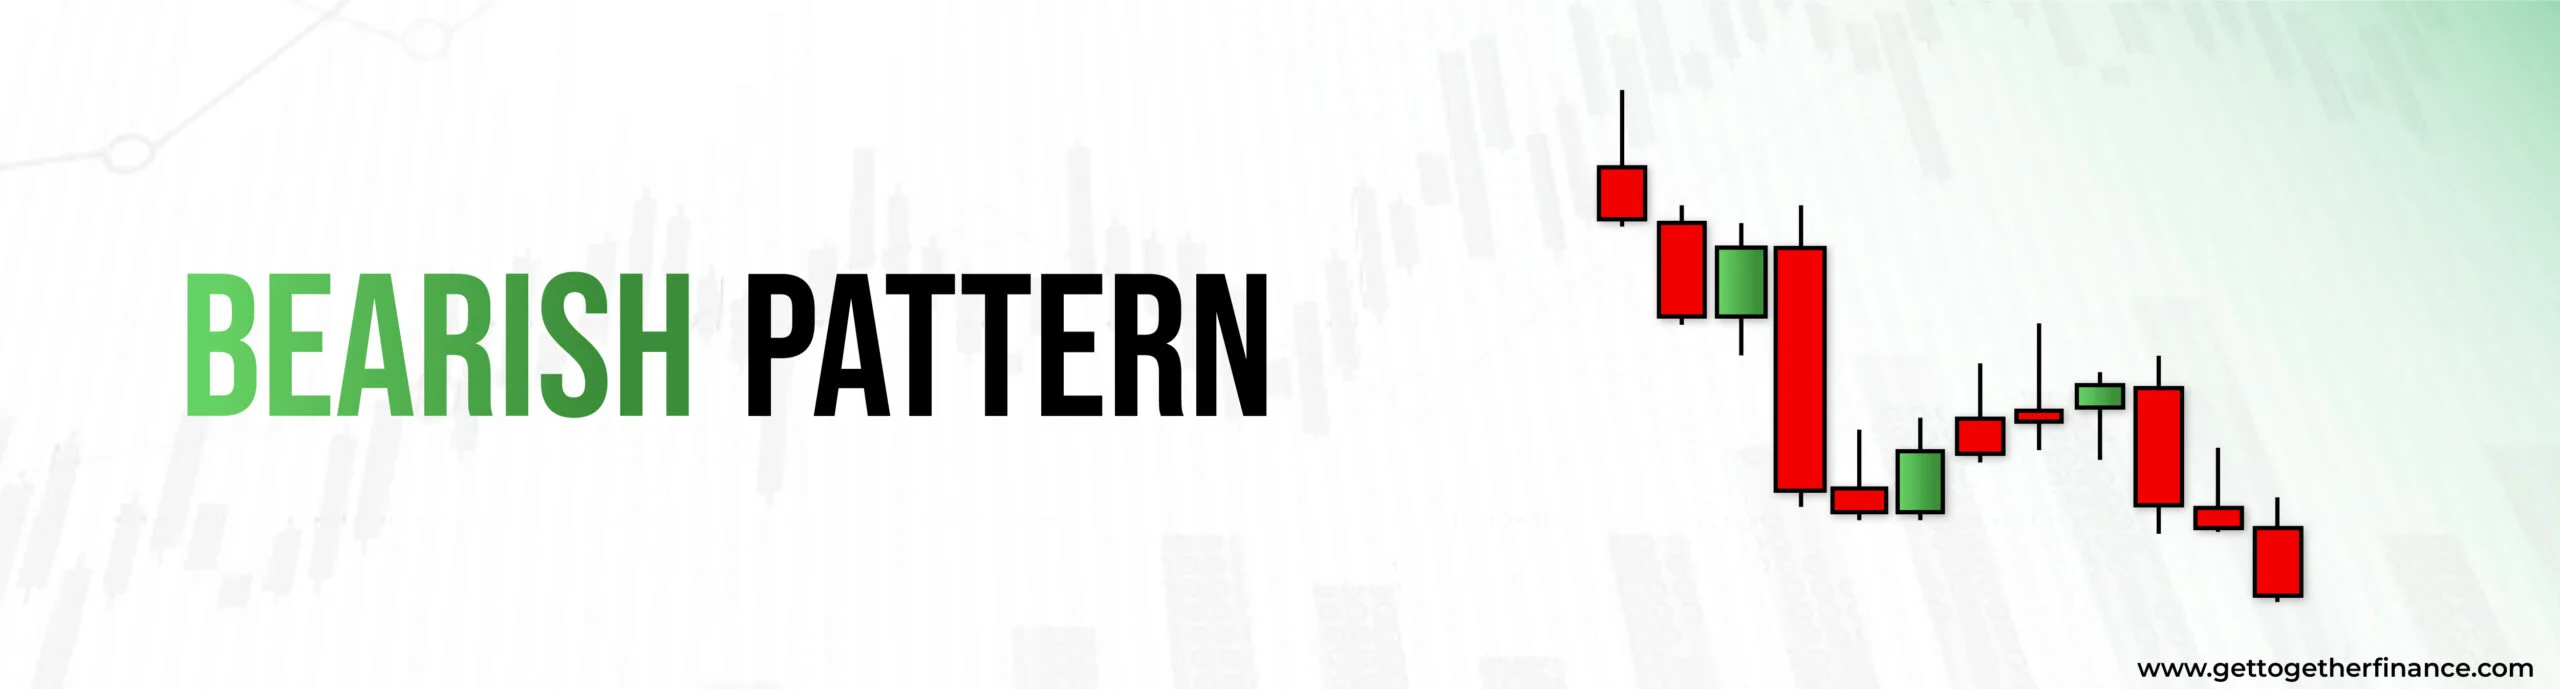
The bearish flag is just vice versa of the bullish flag. The bearish flag appears after the strong down move in price which makes up the flagpole. After the strong down move, a consolidation phase takes place in a parallel channel majorly in the opposite direction of the flagpole which makes up the flag. This indicates a temporary pause after a downtrend which signals traders the potential of the trend continuation. The bearish signal is confirmed when the price breaks down from the lower parallel line of the flag.
Now you must have understood how both patterns work. A bullish flag pattern signals a strong up-move. Whereas, the bearish flag pattern signals a strong down move. But, the similarity in both patterns is that they both signal the continuation of their respective trends.
Also Read: Trendline
What Is the Psychology Behind the Flag Pattern?

The psychology behind the flag chart pattern is all about a pause before continuation. When a strong move happens—either up or down—it creates excitement among traders. This excitement is reflected in the sharp move called the flagpole.
After a strong move (up or down), traders start booking profits. This profit-booking creates a small pullback, and the price begins to move inside a tight range. This range becomes the flag.
During this time:
- Buyers and sellers are in balance
- New traders wait for confirmation
- Big players quietly add positions
- The market gathers strength for the next move.
This entire behavior creates the flag pattern in trading. Because once the price breaks out of the flag, it shows that momentum is back, and trend continuation is highly likely.
How to Identify the Flag Patterns?
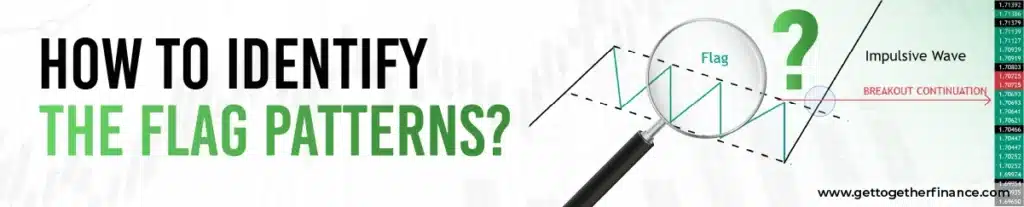
It is not that hard to find or spot flag patterns as hard as it is to find like head and shoulder or cup and handle.
1) Spot the flagpole:-
The flagpole of the pattern is spotted with the strong price movement in the either side. This can be differentiated as:-
- Bullish Flag Pattern: Strong Up move
- Bearish Flag Pattern: Strong Down move
2) Spot the consolidation:-
Now after spotting the flagpole in a strong price movement; look for a consolidation or retracement that takes place in the form of a rectangle, it makes up the flag body. Many traders find it difficult to spot the flag part so you can make it easy for yourself by drawing two parallel trend lines that cover the consolidation and make up the rectangle or flag body.
What Are the Key Characteristics of a Valid Flag Pattern?

A good flag pattern in trading has certain clear characteristics:
- A strong and sharp move first (flagpole)
- A small consolidation against the trend
- Consolidation should form between parallel trendlines
- Price movement inside the flag should be tight
- Volume decreases during consolidation
- Breakout happens in the same direction as the original trend
- Breakout should be supported by strong volume
When all these points match, the flag pattern is considered valid and reliable.
How Can Volume Confirm a Flag Pattern Breakout?
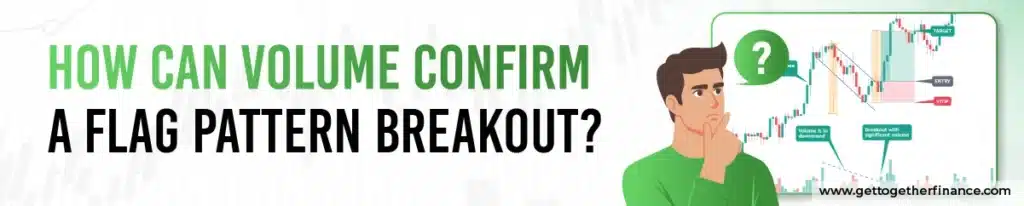
Volume plays a crucial role in confirming a flag breakout pattern. In fact, volume helps traders differentiate between a real breakout and a false trap. Here’s how volume typically behaves in a valid flag candlestick pattern:
- Strong Volume During the Flagpole:
Shows strong buying or selling interest as the trend begins. - Low Volume During the Consolidation:
This reduced volume reflects temporary exhaustion and profit-booking. - High Volume on Breakout:
This is the most important signal. When the price breaks out of the flag with above-average volume, it confirms real participation and increases reliability.
If the breakout happens on low volume, it may be a fake breakout or a trap. That’s why here traders often wait for volume confirmation before entering a flag pattern trade.
How to trade flag patterns?
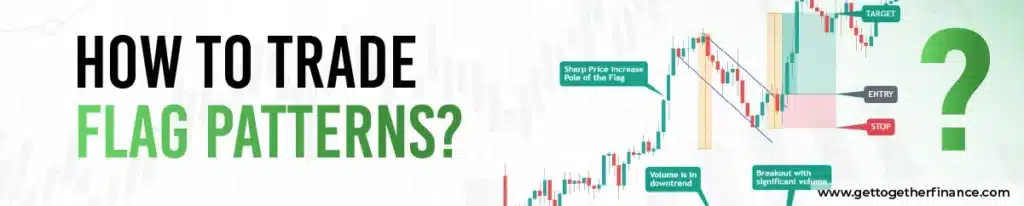
- Entry: – Enter and position yourself into the trade after the price breaks out of the flag consolidation in the direction of the prior move that made up the flagpole.
- Stop-loss: – Keep the stop loss above or below the flag body respectively for bullish and bearish flag patterns as simple as that.
- Target: – The price target can be kept at the same length as the flagpole. In the same direction as the flagpole which will complete the pattern successfully by continuing the trend.
What Is the Best Timeframe for Trading Flag Patterns?
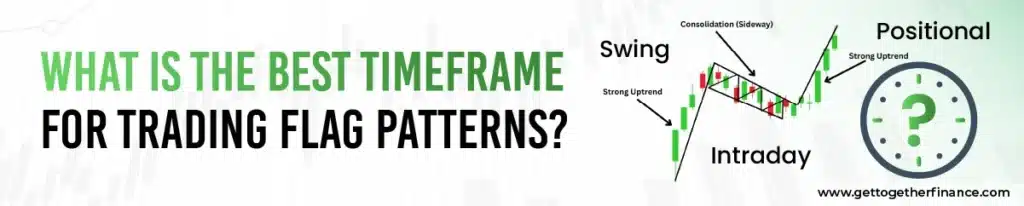
Flag patterns appear across all timeframes, but the best timeframe depends on your trading style:
- Intraday Traders
5-min, 15-min, and 30-min charts show many flag pattern opportunities. It’s great for quick breakout trades.
- Swing Traders
1-hour and 4-hour charts give more reliable signals with better risk–reward.
- Positional Traders
Daily charts are the strongest. Even Daily chart flag breakouts often lead to large continuation moves.
In general:
- Lower timeframes = more trades but more noise
- Higher timeframes = fewer trades but higher accuracY
For most traders, 15-minute to daily charts work best for the flag pattern in the stock market.
How Reliable Are Bullish and Bearish Flag Patterns?
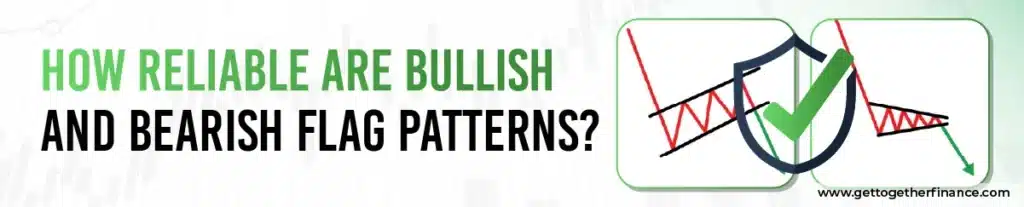
Flag patterns are considered one of the most reliable trend continuation patterns, especially when traded with confirmation. However, reliability depends on a few factors:
High Reliability When:
- A strong flagpole exists
- Consolidation is tight and disciplined
- Breakout happens with volume
- Market trend is clear and supportive
- No major news is coming
Low Reliability When:
- Breakout happens with low volume
- Consolidation becomes too long
- Patterns form in a choppy, sideways market
- Support or resistance zones are nearby
Overall, flag patterns have good success rates, but like any pattern, they should always be traded with a proper stop-loss.
Now you might be thinking why wait for the break of the flag?
To avoid the time consumed by the consolidation in the flag. Let me make it simple, the increase in the demand or supply leads to the formation of a flag pattern which also results in the movement of prices going up or down. The movement of prices going up and down is known as the consolidation phase in a flag pattern.
In simple words, it can be said that a balance of demand and supply results in price consolidation, and an imbalance in demand and supply will lead to a breakout from an upward or downward direction in a bullish and bearish flag pattern respectively. So to avoid this situation of consolidation traders usually take entry after the breakout to minimize the holding time period of the trade.
What Are Common Mistakes Traders Make with Flag Patterns?

Even though the flag chart pattern is easy to spot, many traders still make common mistakes that lead to avoidable losses:
- Entering Before Breakout
Many traders jump in early, thinking they’ll catch a bigger move. But entering before the breakout increases the risk of getting stuck in consolidation. - Ignoring Volume
Breakouts without volume confirmation often fail. Volume is the backbone of a valid flag pattern. - Confusing Flags with Range-Bound Markets
Not every small channel is a flag. A valid flag must be preceded by a strong flagpole. - Placing Stop Loss Too Tight
The price may retest the breakout zone. A tight SL can result in premature exits. - Expecting 100% Accuracy
No pattern works all the time. Even the best bullish or bearish flag pattern trading can fail due to market conditions.
Avoiding these mistakes can drastically improve your flag pattern trading results.
Difference between flag and pennant pattern
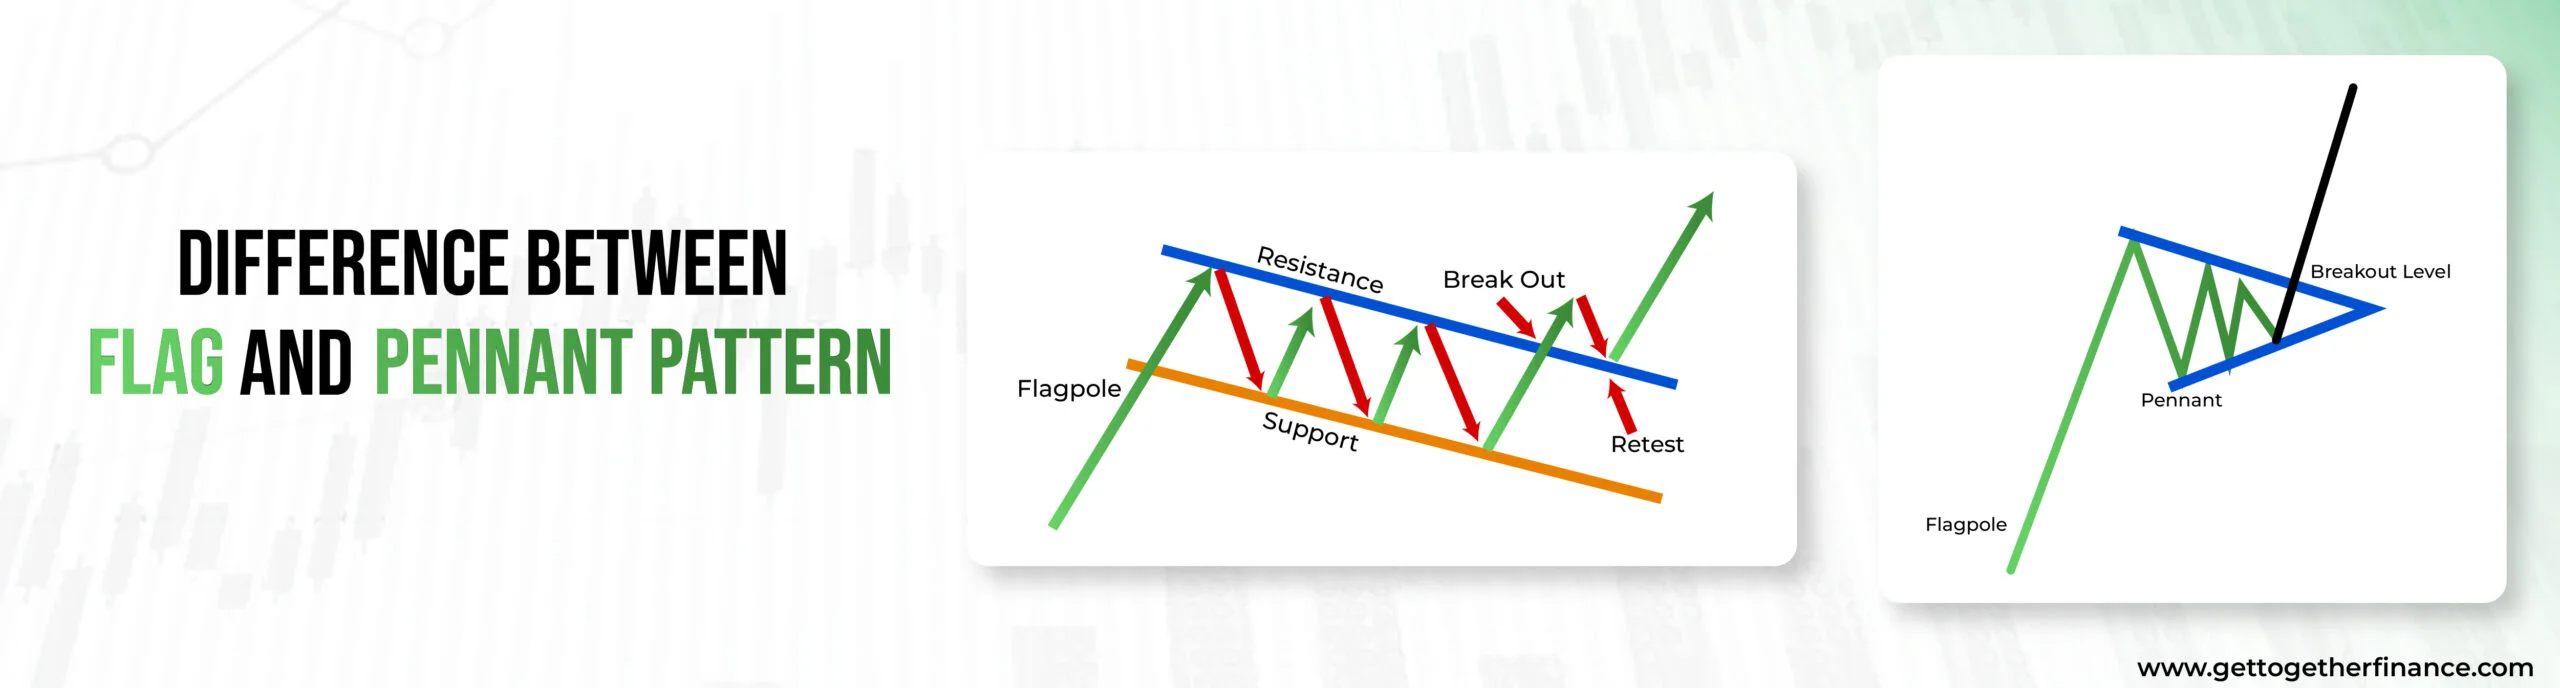
As we have told you earlier, the flag pattern consists of two parallel lines. Many traders find it difficult to spot the difference between flag and pennant patterns. They tend to confuse easily, to make it simple just keep in mind that the working of these patterns is almost similar. They signal the pause in the continuation of a trend, which can be both downward or upward. The only difference you would be able to spot in these two would be in their consolidation phase.
The consolidation phase of the flag pattern is parallel trend lines in the shape of a rectangle and on the other hand, the pennant pattern has a consolidation phase that seems to be converging trend lines like a triangle heading sideways.
Top 4 Chart Patterns For Trading
Cup and Handle Pattern
As the name implies, the cup and handle pattern looks like a teacup with a handle on a candlestick chart. It starts with the formation of a “U” shape which is created by consecutive lows followed by consecutive highs. Once this “U” shape is completed, the price tends to drop again slightly but then moves sideways. This new low is higher than the previous one. After that small drop, the price rises again creating a smaller U or V shape which is known as handle. It is a reliable signal of a bullish trend.
Double Top Pattern and Double Bottom Pattern
A double-top pattern usually emerges at the conclusion of an upward rally or an uptrend. where price consistently reaches new highs, marking various resistance levels. However, when the price consolidates within the same resistance zone on two different occasions making an M-shape on the candlestick chart, it indicates the formation of a double-top pattern.
It is vice versa for the Double-Bottom Pattern, which usually emerges at the conclusion of a downward rally or downtrend. Where the price consistently sets new lows marking various support levels. However, when the price consolidates within the same support zone on two different occasions it makes a W-shape on the candlestick chart which indicates the formation of a double-bottom pattern.
Head and shoulder pattern
In the Head and Shoulder pattern, the left shoulder or the initial peak on the left side resembles a small hike in the stock price. This leads to the prominent peak in the middle similar to the head in a human body typically the highest peak or rise in stock price.
Then comes the last bump or peak on the right side, similar to the right shoulder which is less in height than the head. These all peaks are connected at the bottom by a line forming a “neckline”. If the price of the stock falls below the neckline, it may suggest a shift in the uptrend, signaling a potential further drop in price.
Rectangle pattern
A rectangle pattern is the same as the flag pattern or a flag pattern without a flagpole is a rectangle pattern. It can be witnessed when the price fluctuates between horizontal support and resistance levels. It concludes when a breakout occurs, making the price move beyond the boundaries of the rectangle.
Conclusion
Although a flag pattern is powerful and a moneymaking pattern, it’s very important to keep in mind that no trading pattern is risk-free or zero-trapping, as trading involves risk. Although flag patterns are among some of the most successful trading strategies and a go-to choice of breakout traders. That’s why traders use both bull and bear flag chart patterns to identify the continuation of the trend.
FAQs
How a flag pattern can be identified?
Whenever you see a Sharp price movement either upward or downward direction, leading the price to a consolidation phase then rest assured a flag pattern formation is in the process.
What is the use of a flag pattern in trading?
Traders can use the flag pattern to make trading decisions by looking for a potential breakout or continuation of the prior trend for their own benefit.
Is the flag chart pattern reliable for long-term investing?
Usually flag pattern is used as a short-term pattern. For long-term investment, one can look for other patterns like head and shoulder and other technical analysis tools.
Can bear and bull flag patterns always be witnessed in the stock market?
Yes, the bear and bull flag pattern can usually be witnessed in the stock market. For clarity, one should look at the area of consolidation and the ongoing trend too.


