Gravestone Doji – Overview, Formation, and Trading
- Updated on : February 3, 2026
- 1828 Views
- by Arun Singh Tanwar

 Facebook
 Instagram
 Youtube
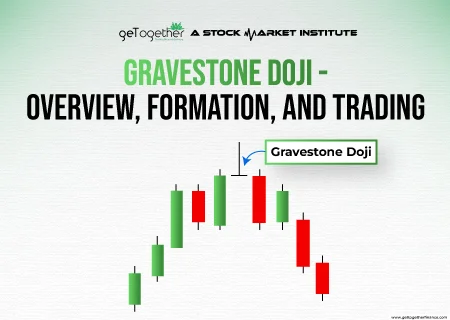
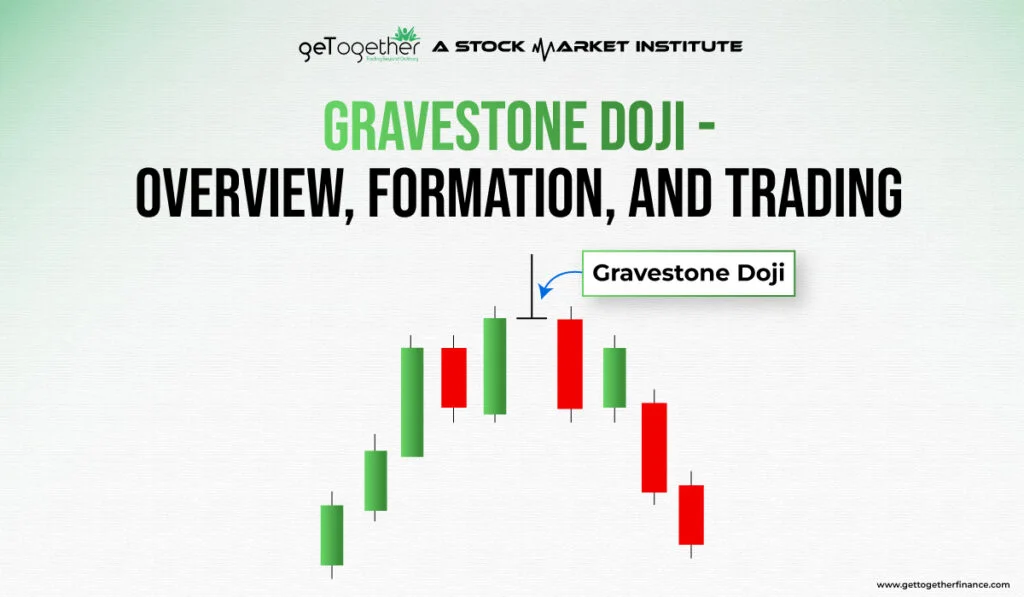
The Gravestone Doji is a candlestick pattern frequently used in technical analysis to identify potential trend reversals in financial markets. It is considered a bearish reversal pattern and is characterized by a long upper shadow, a small or non-existent body, and little to no lower shadow. The name “Gravestone Doji” is derived from its resemblance to an upright gravestone.
What Is a Gravestone Doji?
The gravestone doji is a candlestick pattern commonly used in technical analysis to identify potential trend reversals in financial markets. It is characterized by a specific candlestick shape that resembles a gravestone standing upright, hence the name.
Gravestone Doji Candlestick Pattern Overview
The gravestone doji candlestick pattern is formed when the open, high, and closing prices are all at or near the same level, typically at the low of the trading period. This creates a long upper shadow, or wick, and little to no lower shadow. The pattern suggests that buyers initially pushed the price higher but were unable to maintain control, resulting in a potential shift in market sentiment.
How is the Gravestone Doji Candlestick Pattern Formed?
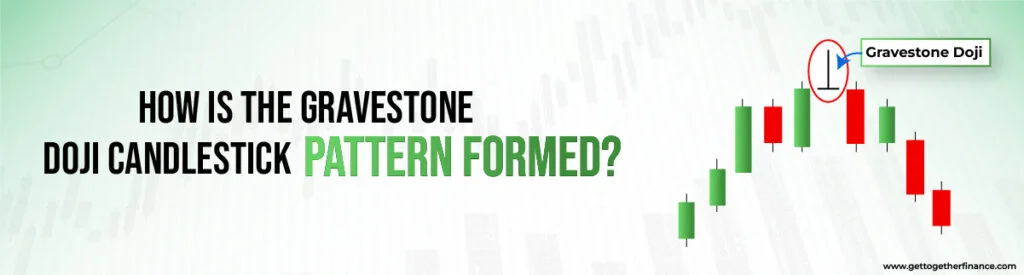
The formation of a gravestone doji candlestick pattern requires specific price action. During the trading period, buyers push the price higher, but eventually, sellers take control and drive the price back down to or near the opening level. This creates a long upper shadow and a small or non-existent lower shadow, forming the distinctive shape of a gravestone doji.
The formation of a gravestone doji suggests a potential reversal in market sentiment. It occurs when buyers initially push the price higher but are unable to maintain control, resulting in sellers stepping in and pushing the price back down.
Trading the Gravestone Doji: Strategy and Confirmation

While the Gravestone Doji is a powerful indicator, traders rarely rely on it alone. It is critical to seek confirmation signals to validate the pattern before making any trading decisions.
1. Key Confirmation Signals
- Additional Technical Indicators: Use tools like moving averages, trendlines, or oscillators such as the Relative Strength Index (RSI) or Moving Average Convergence Divergence (MACD).
For example, if the Doji forms in the overbought territory indicated by the RSI, the bearish signal is strengthened.
- Volume Analysis: An increase in trading volume accompanying the pattern provides stronger confirmation. High volume suggests a larger number of participants drove the price reversal, making the signal more significant.
- Next Candlestick: The most immediate confirmation is often a bearish candle (a red or black candle) that forms immediately after the Gravestone Doji and closes below the Doji’s low.
2. Market Context is Crucial
The effectiveness of the Gravestone Doji is heavily dependent on the overall market environment.
- Prevailing Trend: The pattern carries the most weight when it appears at the peak of an established uptrend.
- Support and Resistance: If the Gravestone Doji forms near a significant resistance level, it strongly indicates that this resistance is holding, increasing the probability of a bearish reversal.
3. Risk Management Essentials
- Stop Loss Placement: A prudent risk management technique is to place a stop loss order above the high of the Gravestone Doji. This limits potential losses if the market reverses direction and the pattern fails to hold.
Take Profit Levels: Determine appropriate take profit levels based on the price action and key support levels below the entry point.
Also Read: Doji Candlestick
How Reliable Is the Gravestone Doji Pattern in Predicting Market Reversals?
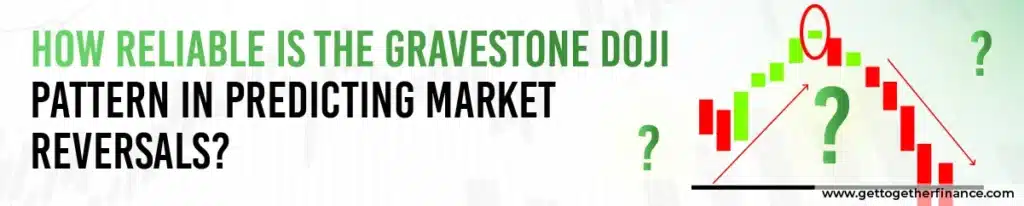
The reliability of the Gravestone Doji candlestick pattern is a critical concern for any trader. It’s important to understand that no single candlestick pattern, including the Gravestone Doji, is 100% reliable on its own. It should be seen as a strong warning signal, not an automatic trade trigger.
The pattern’s effectiveness hinges entirely on the market context:
- High Reliability: The pattern is highly reliable when it appears at the peak of a clear, sustained uptrend and forms near a major, established resistance level. In this scenario, it clearly demonstrates that sellers are stepping in aggressively to stop the upward momentum.
- Low Reliability: Its reliability drops significantly in sideways markets or during choppy, indecisive trading. Here, the pattern may only signal a temporary pause or a small pullback, rather than a significant market reversal.
To treat the Gravestone Doji candlestick as a highly reliable signal, you must wait for confirmation from subsequent price action and other technical indicators.
Common Mistakes Traders Make When Interpreting a Gravestone Doji

Even experienced traders can misinterpret the Gravestone Doji, leading to unnecessary risk or missed opportunities. Avoiding these common mistakes will significantly improve your trading results:
- Trading Without Confirmation: The most frequent error is immediately entering a short trade right after the Doji Gravestone closes. This is a premature move. You must wait for the confirmation candle (the candle immediately following the Doji) to close lower than the Doji’s body to confirm the bearish reversal pattern.
- Ignoring the Trend: Assuming the Doji means a reversal will happen even if the preceding uptrend is extremely strong and powerful. The stronger the underlying trend, the more powerful the confirmation needs to be.
- Improper Stop Loss: Failing to place a protective stop loss just above the highest point (the high of the long upper shadow) of the Doji Gravestone. This exposes your trade to large losses if the market suddenly decides to continue the original upward move.
- Disregarding Volume: Treating the pattern equally whether it forms on high volume or low volume. A Gravestone Doji on low trading volume is weak and often meaningless, while high volume validates the strength of the selling pressure.
Which Technical Indicators Work Best to Confirm a Gravestone Doji Signal?

Using auxiliary technical indicators is mandatory to confirm the Gravestone Doji and boost its predictive power. The best indicators are those that align with the pattern’s bearish reversal message:
- Volume: As mentioned, a spike in trading volume accompanying the formation of the Doji is the strongest confirmation. It signifies that institutional money and a large number of participants are driving the rejection of the high price.
- Relative Strength Index (RSI): Look for the Gravestone Doji to form when the RSI indicator is in the overbought territory (typically above 70). This combination tells you that the upward move is running out of steam and a reversal is due.
- Resistance Levels and Trendlines: The pattern gains immense strength if it touches or forms right beneath a major historical resistance level or a falling trendline. This shows the pattern is confirming a known barrier to price movement.
- Moving Average Convergence Divergence (MACD): A Gravestone Doji is stronger if the MACD indicator is simultaneously showing a decrease in upward momentum, such as a flattening histogram or a near-term bearish crossover (the MACD line crossing below the signal line).
Can Multiple Gravestone Dojis Form in a Row? What Does It Indicate?
It is possible for multiple Gravestone Dojis to form in a row, although it is not a common occurrence. This sequence, where two or even three such candles appear consecutively, provides a powerful and amplified message to traders:
- Extreme Price Rejection: The occurrence of multiple Dojis at the same price ceiling demonstrates a highly persistent and successful effort by sellers to reject the upward move over multiple trading periods.
- Solid Resistance: The high price reached by these consecutive candles establishes an extremely strong, fortified resistance level. Buyers have repeatedly failed to sustain a rally above this point.
- Heightened Bearish Pressure: Instead of signaling just indecision, multiple Dojis indicate an escalation of selling pressure, suggesting a major market reversal is not just possible, but highly probable.
When you see this sequence, it’s advisable to pay even closer attention to trading volume for a definitive break and follow-through to the downside, confirming the bearish reversal pattern.
Limitations of the Gravestone Doji
While the gravestone doji can provide valuable insights into potential trend reversals, it is essential to consider its limitations:
- False Signals: Like any technical indicator or pattern, the gravestone doji is not foolproof and can produce false signals. It is crucial to use additional confirmation tools and indicators to increase the reliability of the pattern.
- Market Context: The gravestone doji should be analyzed within the broader market context. Factors such as overall trend, volume, and support/resistance levels can significantly impact the pattern’s effectiveness.
Analyzing the Broader Market Context

Analyzing the overall market context is crucial when considering the gravestone doji pattern. Here are some tips to help you assess the broader market conditions:
- Trend Analysis: Determine the prevailing trend in the market. Is it an uptrend, downtrend, or a sideways trend? The gravestone doji pattern is typically more meaningful when it occurs within the context of an established trend. If the gravestone doji forms against the prevailing trend, it may carry more significance as a potential reversal signal.
- Support and Resistance Levels: Identify key support and resistance levels on the price chart. The gravestone doji pattern near a significant resistance level can indicate a higher probability of a trend reversal. Conversely, a gravestone doji near a strong support level might suggest a potential bounce or continuation of the existing trend.
- Volume Analysis: Pay attention to the trading volume accompanying the formation of the gravestone doji. An increase in volume during the formation of the pattern can provide further confirmation of a potential trend reversal. Higher volume suggests increased market participation and strengthens the significance of the pattern.
- Other Technical Indicators: Utilize other technical indicators to support your analysis. For example, you can examine oscillators like the Relative Strength Index (RSI) or the Moving Average Convergence Divergence (MACD) to identify overbought or oversold conditions. If these indicators align with the gravestone doji’s bearish reversal signal, it strengthens the overall analysis.
- Timeframe Consideration: Analyze the gravestone doji pattern within different timeframes to gain a broader perspective. A gravestone doji on a shorter timeframe (e.g., intraday chart) may have a different significance compared to the same pattern on a longer timeframe (e.g., daily or weekly chart). Consider the relationship between these different timeframes to validate the pattern’s importance.
- Market Sentiment: Assess the overall sentiment in the market. Are investors generally optimistic or pessimistic? This can be determined by monitoring news, economic indicators, and the behavior of market participants. If the gravestone doji pattern aligns with a shift in sentiment, it can carry greater significance.
- Market Structure: Evaluate the structure of the market. Is it displaying clear patterns or is it choppy and unpredictable? The effectiveness of the gravestone doji pattern can vary depending on the market structure. In well-defined trends or chart patterns, the pattern may have stronger predictive power.
- Correlation with Other Assets: Consider the correlation between the asset displaying the gravestone doji pattern and other related assets or markets. For example, if you’re analyzing a stock, examine the performance of the broader market index or sector it belongs to. If the pattern aligns with weakness in correlated assets, it adds further weight to the potential reversal scenario.
- Fundamental Analysis: Combine technical analysis with fundamental analysis. Consider the underlying factors that may be driving the market. Earnings reports, economic data, geopolitical events, and central bank policies can all influence market sentiment. If the gravestone doji pattern aligns with fundamental factors pointing towards a reversal, it strengthens the analysis.
- Historical Performance: Study the historical performance of the gravestone doji pattern in the specific market or asset you are analyzing. Look for past instances where the pattern occurred and observe how the market reacted afterward. This can provide insights into the pattern’s reliability and help you gauge its potential effectiveness.
It’s crucial to use the gravestone doji pattern as part of a comprehensive analysis, incorporating other technical tools, market context, and risk management strategies. By combining multiple factors, you can make more informed trading decisions and reduce the risk of false signals.
The Different Types of Doji Patterns

Doji patterns are characterized by their shape, where the opening and closing prices are close to each other, resulting in a small body. Besides the gravestone doji, there are other common types of doji patterns, including:
- Dragonfly Doji: It has a long lower shadow and no upper shadow, resembling an inverted T.
- Long-Legged Doji: It has long upper and lower shadows, indicating indecision and potential market reversal.
- Four Price Doji: It occurs when the opening, closing, high, and low prices are all the same, resulting in a small cross-shaped candlestick.
Examples of Gravestone Doji
Here are a few examples of gravestone doji patterns in different financial markets:
Example: Sail
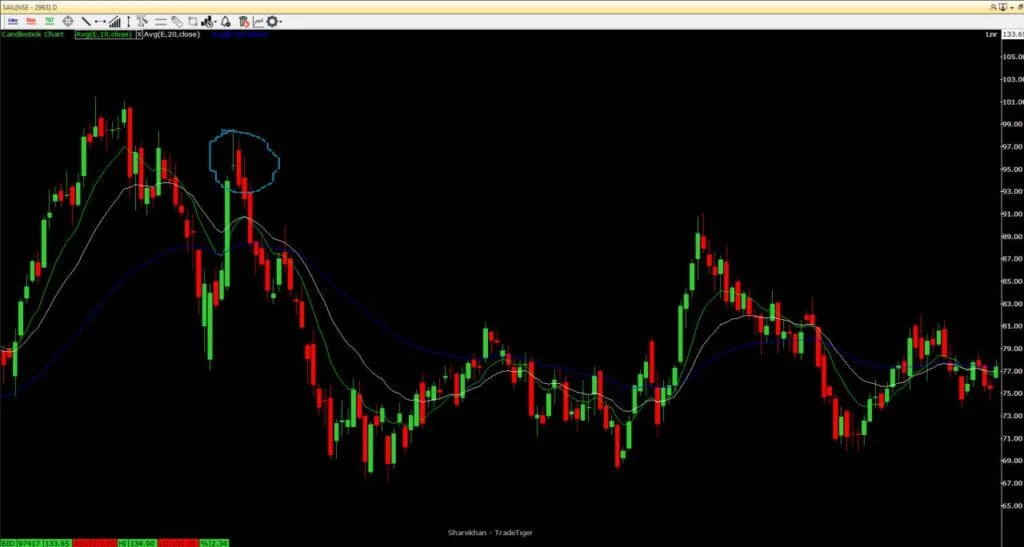
In a daily chart of sail, the price opens at 95.35. It then rallies to a high of 98.30 but encounters selling pressure and closes near the opening price at 95.35. The low of the day is 94.90. The resulting candlestick has a long upper shadow, a small body, and little to no lower shadow, resembling a Gravestone Doji. This pattern indicates potential bearish reversal signals.
Gravestone Doji vs. Dragonfly Doji
It is important to understand the key difference between the Gravestone Doji and its inverse, the Dragonfly Doji, as they have opposite implications for the market.
| Feature | Gravestone Doji | Dragonfly Doji |
| Shape | Long Upper Shadow, small body near the low. | Long Lower Shadow, small body near the high. |
| Indication | Bearish Reversal | Bullish Reversal |
| Formation | Open, low, and close are near the same level. | Open, high, and close are near the same level. |
| Meaning | Rejection of higher prices by sellers. | Rejection of lower prices by buyers. |
Limitations of the Gravestone Doji
While the gravestone doji can provide valuable insights into potential trend reversals, it is essential to consider its limitations:
- False Signals: Like any technical indicator or pattern, the gravestone doji is not foolproof and can produce false signals. It is crucial to use additional confirmation tools and indicators to increase the reliability of the pattern.
- Market Context: The gravestone doji should be analyzed within the broader market context. Factors such as overall trend, volume, and support/resistance levels can significantly impact the pattern’s effectiveness.
Conclusion
The gravestone doji is a candlestick pattern that can provide valuable insights into potential trend reversals. Traders use this pattern in combination with other technical tools and indicators to make informed trading decisions. However, it is essential to consider the pattern within the broader market context and to use proper risk management techniques when implementing trading strategies based on the gravestone doji pattern.
FAQ
Is a Doji bullish or bearish?
A doji candlestick pattern alone doesn’t indicate a specific bullish or bearish bias. It represents market indecision and suggests a potential trend reversal or continuation, depending on the context and subsequent price action.
Can a Gravestone Doji be bullish?
No, a gravestone doji is considered a bearish reversal pattern. It suggests that buyers initially pushed the price higher but failed to maintain control, indicating a potential shift in sentiment from bullish to bearish.
What is the meaning of Doji on a gravestone?
The presence of a Doji on a gravestone pattern signifies market indecision and potential trend reversal. It indicates that despite initial buying pressure, sellers were able to push the price back down, resulting in a long upper shadow and little to no lower shadow.
What is the best way to trade a gravestone Doji?
When trading a gravestone doji, it is crucial to wait for confirmation signals before taking any action. This can include additional technical indicators, candlestick patterns, or shifts in trading volume. It is also advisable to consider the overall market context, support and resistance levels, and risk management techniques such as setting appropriate stop loss and take profit levels.
What is the Gravestone Doji with Gap-up?
A gravestone doji with a gap-up occurs when the opening price of the trading period is significantly higher than the previous closing price, creating a gap on the price chart. The gravestone doji pattern is then formed as the price retraces from the opening level, resulting in a long upper shadow and a small or non-existent lower shadow. This pattern suggests a potential exhaustion of buying pressure and a higher likelihood of a trend reversal.


