
Symmetrical Triangles vs Pennant Patterns: What’s the Difference?
- Updated on :
- 4748 Views
- by Suhani

 Instagram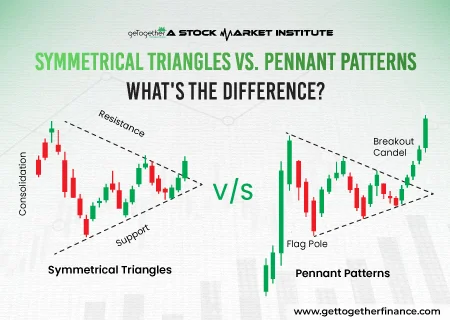
Quick Answer: Symmetrical Triangle vs Pennant Pattern
In technical analysis, symmetrical triangle vs pennant is a common comparison because both patterns have converging trendlines. But they form differently and mean different things.Simply a symmetrical triangle is formed when the price consolidates up and down between two converging trendlines that narrow toward an apex. A breakout occurs when price moves beyond one of the trendlines and is confirmed by the price action.
After a strong trend, it can be either a downtrend or an uptrend. It signals a break in the trend before the price continues to move in the previous direction again. Conventional traders consider these patterns important because it helps them understand market sentiments and direction. By knowing and understanding the difference between both patterns, traders can easily avoid trading false, breakout, and misinterpretation of some signals. This eventually will help them master their trading strategy..
What is a Symmetrical Triangle?

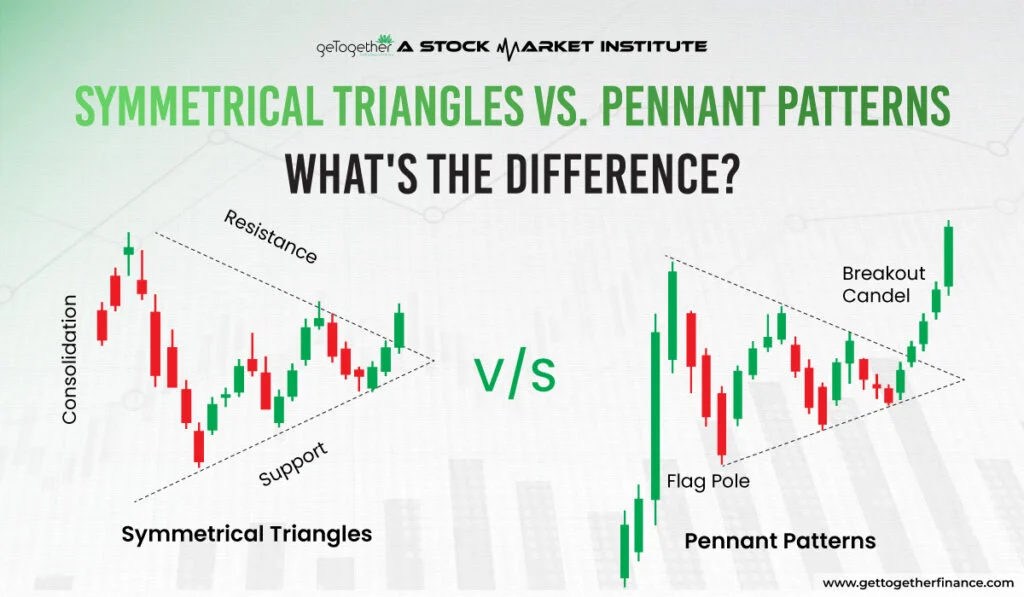
A symmetrical triangle is one of the prominent patterns that can be seen in candlestick charts. It is a pattern where the price of stocks moves between two converging lines. The upper trendline is directed downwards and the lower trendline line directed upwards. As the trendlines squeeze closer to the apex, traders watch for a breakout past either line before they treat the pattern as confirmed.
Usually, this pattern is formed when the market is in a consolidation phase. This is because the price is not able to break a certain range. This is the result of buyers and sellers having close fights.
Once the breakout is confirmed, price may keep moving in that direction, beyond the triangle.
Symmetrical Triangle Breakout: Bullish vs Bearish Confirmation
- Bullish Scenario: If the price closes above the upper trendline, it confirms a bullish breakout. Higher volume can help confirm the breakout, and if the price comes back to retest the broken trendline, that’s another sign the breakout is holding.
- Bearish Scenario: If the price closes below the lower trendline, it confirms a bearish breakout. Higher volume can support the move, and a retest of the broken trendline can act as an extra, optional confirmation.
This brings us to the understanding that symmetrical triangles come under the neutral pattern, so you shouldn’t guess the direction just from the triangle’s shape before it breaks out. Traders need to wait for solid proof, like a closed candle beyond the line, and may also use volume or a retest to confirm the breakout is genuine.
What is a Pennant Pattern?

A pennant pattern is a small symmetrical triangle that usually forms after a strong price move, known as a pennant flagpole. It sometimes looks like the flag on a pole, but it is much smaller and pointed too. It is usually created when the price consolidates for a brief period, with highs and lows converging and moving close. If there’s no clear flagpole (sharp move) before the pattern, traders should think twice before calling it a pennant.
Flag vs Pennant vs Symmetrical Triangle: Do Not Confuse These Patterns
A pennant, flag, and symmetrical triangle can look alike on a chart, but they’re built differently. The main differences lie in the trendlines, size, and how the pattern forms.
| Aspect | Pennant | Flag | Symmetrical Triangle |
| Trendlines | Converging trendlines | Parallel trendlines | Converging trendlines |
| Consolidation | A brief break after a sharp move | Can show a longer break in price movement | Can take a longer time to form during consolidation |
| Trend Indication | Generally indicates continuation of the previous trend | Generally indicates continuation of the previous trend | Stays neutral until the breakout shows which way price is heading |
| Shape | Small, narrow triangular formation | Sloping rectangular or channel-like formation | Larger triangle formed by converging trendlines |
| Size | Generally smaller and tighter | Generally larger than a pennant | Generally larger than a pennant |
| Prior Price Move | Usually forms after a strong price move, called the flagpole | Usually forms after a sharp price move | Doesn’t need a clear sharp move before it forms |
| Breakout Context | Usually breaks out in the same direction as the earlier move | Usually breaks out in the same direction as the earlier move | Can break out either up or down |
By understanding the differences, traders can distinguish between the three patterns, rather than judging them just by how similar they look.
Typical Occurrence and Market Sentiment
A pennant pattern is formed after a strong move either on the downside or upside, suggesting the market is taking a short break before continuing the trend. This pattern usually signals that the previous trend will resume once the price breaks out of the trend. The market sentiment is hesitant during the formation of the pennant pattern, but it often loosens up with strong momentum in the breakout direction.
Symmetrical Triangle vs Pennant: 7 Key Differences
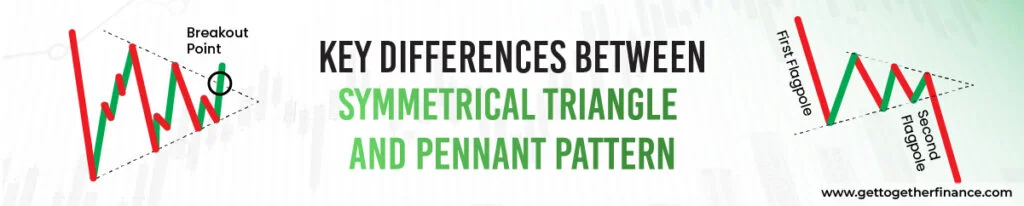
The symmetrical triangle vs pennant difference can be understood by comparing the price move before it, its shape, how long it lasts, its direction, volume, breakout trigger, and target.
| Aspect | Symmetrical Triangle | Pennant Pattern |
| Shape | A large, symmetrical triangle with converging trendlines | A small, narrow triangle, resembling a flag-shape |
| Formation Duration | Forms over a longer period, indicating extended consolidation | Forms quickly, usually within a few weeks after a sharp price move |
| Size | Larger in size compared to pennants | Smaller and tighter compared to symmetrical triangles |
| Volume | Volume typically decreases as the triangle narrows | Volume decreases during the consolidation, then spikes at the breakout |
| Trend Indication | Can break in either direction (neutral until breakout) | Usually follows a strong price move and continues in the same direction |
| Pattern Location | Can appear after a trend or during a pause | Occurs after a sharp price move, often seen as a brief consolidation |
| Breakout Direction | Breakout can be in any direction, depending on the prior trend | Breakout is expected in the direction of the previous trend (up or down) |
How to Trade a Symmetrical Triangle: Entry, Stop-Loss & Price Target
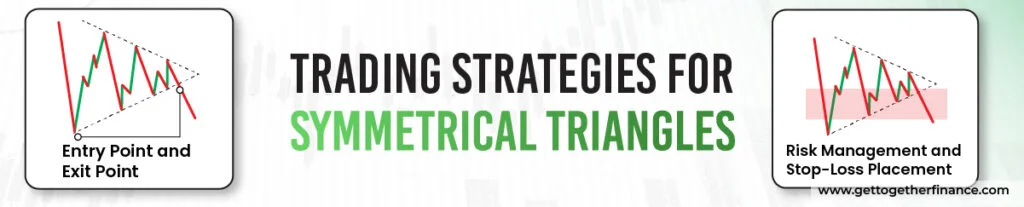
A symmetrical triangle shows the price moving sideways for a while before a possible breakout. As the pattern stays neutral until the breakout, traders usually wait for confirmation before setting up their entry, target, and stop-loss.
Entry and Exit Points
- Entry Point: Traders usually wait for a confirmed breakout instead of entering the moment price crosses a trendline. An upside breakout means price closes above the upper trendline, while a downside breakout means it closes below the lower trendline. Traders can confirm this using the candle close, volume, or a retest.
- Target Point: Here, the exit from the trade is based on the type of move that comes after the breakout. The target is then based on the height of the triangle. In the bullish breakout, the place target above the breakout point is equal to the height of the triangle. On the other hand, in the bearish breakout, place the target below the breakout point equal to the height of the triangle.
Risk Management and Stop-Loss Placement
- Stop-Loss Placement: Before entering, mark the point where the setup would fail. For an upside breakout, that’s usually just below a nearby support or breakout zone. For a downside breakout, it’s usually just above a nearby resistance or breakout zone.
- Risk Management: it is important for traders to use an appropriate risk-reward ratio in every trade. A good strategy will allow a trade to risk only a small amount of its capital. Typically, traders can start from a 1:2 risk-to-reward ratio.
Worked Example
This example is for educational purposes, not a trading recommendation. Let’s say a stock forms a symmetrical triangle, with the highest point at ₹120 and the lowest point at ₹100.
The triangle height is: ₹120 − ₹100 = ₹20
If the price breaks above the upper trendline at ₹115, here’s how you’d calculate the measured-move target: ₹115 + ₹20 = ₹135
If the breakout happens on the downside at ₹105, here’s the projected target: ₹105 − ₹20 = ₹85
The actual price could move differently, so treat this number as just an estimate, not something guaranteed to happen.
Educational Note: This article is only for learning purposes and shouldn’t be taken as financial or trading advice. Technical patterns don’t promise any specific price move or outcome. Since trading carries market risk, readers should think about their own risk tolerance before making any trading decisions.
How to Trade a Pennant: Entry, Stop-Loss & Flagpole Target
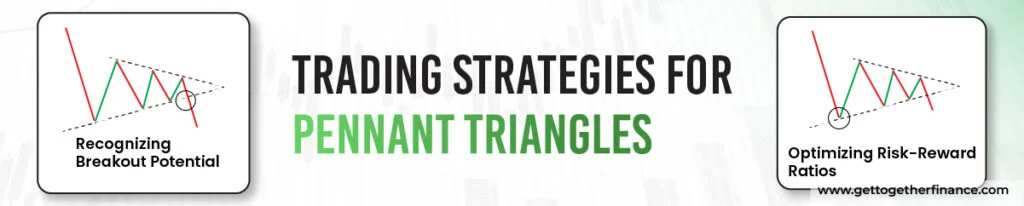
A pennant can help traders spot a possible continuation setup after a strong price move. But the pattern should be confirmed before entering a trade. Here’s a checklist of key things that traders need to check before considering a pennant breakout.
Pennant Breakout Confirmation Checklist
- Close Outside the Trendline: Wait for the price to close clearly above or below the pennant’s trendline, rather than reacting to just an intraday move.
- Breakout in Prior-Trend Direction: A pennant is usually seen as a continuation pattern, so the breakout should move in the same direction as the earlier strong price move.
- Define Invalidation Before Entry: Decide beforehand where the setup would no longer work, and use that level to manage risk.
- Volume Expansion: Watch for rising volume around the breakout, as it helps confirm the price move.
- Avoid Entries Near the Apex: Don’t enter a trade just because the price is nearing the apex. Wait for the breakout to be confirmed first.
Optimizing Risk-Reward Ratios
- Setting Targets: to target measure the range that price traveled in the strong move before the consolidation phase, the same rain should be put as a target after the breakout comes
- Stop-Loss Placement: Set the invalidation level on the other side of the pennant before entering the trade. This will keep you safe in case of your false breakout.
- Risk-Reward Ratio: In every trade, it’s important to use an appropriate risk-to-reward ratio. A good strategy will allow you to risk only a fraction balance of your trading account. A typical ratio to aim for is 2:1, meaning you expect to make twice as much profit as you are risking on the trade.
Worked Example
This example is for educational purposes, not a trading recommendation. Let’s say a stock moves from ₹100 to ₹130 before forming a pennant. The flagpole here is ₹30.
If the stock breaks out above the pennant at ₹125, here’s how you’d calculate the flagpole measured-move projection: ₹125 + ₹30 = ₹155
If the breakout happens on the downside at ₹115, here’s the projection: ₹115 − ₹30 = ₹85
The target isn’t based on how wide the pattern’s consolidation looks: it’s based on how big the earlier sharp price move (the flagpole) was.
Remember this: These patterns work best as part of a bigger technical analysis approach, not as a strategy on their own. Traders can pair them with other tools, like demand and supply analysis and risk-management rules, while also keeping in mind that breakouts can fail and market conditions can change.
False Breakouts: 5 Checks Before Taking a Triangle or Pennant Trade
Sometimes, breakouts from triangles and pennants don’t hold, and price moves back into the pattern. That’s why, before acting on a breakout, traders need to use these five checks to confirm the setup and manage risk.
- Wait for a Candle Close: Wait for a candle to close clearly outside the pattern, instead of reacting to a short-term intraday move.
- Check Volume: A rise in volume around the breakout can add more confirmation to the price move.
- Compare the Prior Trend: For a pennant, check whether the breakout matches the direction of the strong move that happened before the pattern.
- Look for a Retest: If price retests the broken trendline, that can serve as extra, optional proof the breakout is holding.
- Define Invalidation: Before entering a trade, mark the point where the pattern or breakout would fail. This keeps the risk clearly defined.
Conclusion
Symmetrical triangles and pennant patterns are valuable tools for technical analysts because they provide insight into market trends and potential breakout possibilities. While symmetrical triangles represent uncertainty and can break in either way, pennants frequently predict the continuation of a strong preceding trend. Recognising their various properties, including shape, size, formation time, and breakout direction, allows traders to make more informed decisions while lowering the chance of false signals. However, these patterns should not be used only for trading choices. Instead, include them into a larger plan that incorporates extensive technical research and a solid understanding of market dynamics. Combining these patterns with demand and supply zones can improve the accuracy of your trades and help you become a successful trader.
FAQ‘s
What is the key difference between a symmetrical triangle and a pennant pattern?
A symmetrical triangle emerges during long-term consolidation with converging trendlines, but a pennant pattern is a smaller triangle created after a rapid price move, indicating a brief stop before continuing the trend.
Is a pennant always a continuation pattern?
A pennant is usually seen as a continuation pattern, but the breakout still needs to be confirmed before you rely on its direction.
Does a symmetrical triangle need a flagpole?
No, unlike a pennant, a symmetrical triangle doesn’t need a strong move or flagpole before it forms.
Which pattern forms faster?
A pennant tends to form quickly since it’s just a brief pause after a sharp move. A symmetrical triangle, though, often takes more time to develop.
How do target calculations differ?
For a symmetrical triangle, traders usually use the height of the triangle to work out the target. For a pennant, they usually measure the flagpole’s length from the breakout point.
Can volume confirm the breakout?
Higher volume around a breakout can add extra confirmation, but volume alone doesn’t guarantee the breakout will hold.



