
Multi-Timeframe Analysis: How Professional Traders Use Top-Down Analysis
- Updated on :
- 11 Views
- by Charul Shakya

 Instagram
 Linkedin

A stock might look like it’s going up on a 15-minute chart, but the daily chart could be telling a different story. If you check only one timeframe, you could miss the overall trend, and without that big trend, the short-term moves don’t make sense. This is when multi-timeframe analysis really helps. It helps traders view the same market in different ways, starting with the big trend and slowly zooming in until a trade opportunity appears. This approach is also known as top-down analysis. So how does this work, and how do traders choose the right timeframes? Let’s understand it properly.
What Is Multi-Timeframe Analysis?

Multi-timeframe analysis is studying the same stock, index, or market on more than one chart timeframe instead of sticking to a single one. It helps traders see the bigger trend while also checking the shorter-term price movements. For example, a trader may check the daily chart to spot the overall direction, the 4-hour chart to track how the setup is forming, and the 1-hour chart to find a good entry point. Each timeframe plays a specific role: Higher timeframes deliver market context, whereas lower timeframes give a more detailed view of price action.
By combining these views, traders can understand the overall market direction and also sharpen their analysis for a potential trade. This makes it easier to focus on the right timeframes instead of checking too many charts without reason.
What Is Top-Down Analysis in Trading?

Top-down analysis means studying the market by starting with the bigger view and then moving toward smaller timeframes. It’s like looking at a map before picking a road. The bigger view shows you the overall direction, while the close-up view helps you decide the exact path.
In trading, the higher timeframe shows the overall market direction. The middle timeframe shows the current position, and the lower timeframe helps you spot a possible entry point. Both multi-timeframe analysis and top-down analysis are related, but not the same. Multi-timeframe analysis is about studying the same market on multiple timeframes, while top-down analysis is about going from the higher timeframe to the lower timeframe.
Why Use Multiple Timeframes?

When traders check multiple timeframes, they get more context and a clearer picture before making decisions. By seeing a short-term price movement alone, it seems important, but after placing it within the broader market trend, it looks different. This is why every timeframe should serve a specific purpose.
Higher Timeframes for Market Context
With higher timeframes, traders can better understand the broader direction of price. For instance, the daily chart may show the stock forming higher highs and higher lows, which indicate an upward trend. Meanwhile, the 1-hour chart might show a temporary drop. This drop may seem concerning if you look at it alone, but the daily chart helps explain it better.
Lower Timeframes for Trade Entries
When the overall direction is clear, traders can shift to a smaller timeframe to examine the price action properly. For example, if the daily chart shows an uptrend and the 4-hour chart shows a pullback near support, the 1-hour chart can help you spot a possible entry. The lower timeframe isn’t for deciding the trend; that’s already done on the higher timeframe. It just helps you enter at a better point within that trend.
How Multiple Timeframes Reduce Conflicting Signals
By comparing different timeframes, traders can better understand how short-term price movements connect with the overall trend. For instance, the lower timeframe may show a temporary drop even while the bigger trend is going up. In the same way, a short-term rise can happen even during a bigger downtrend.
By looking at both timeframes, traders avoid seeing every small price move as a sign of a major trend shift. However, using multiple timeframes doesn’t get rid of uncertainty or promise a winning trade.
How Multi-Timeframe Analysis Works

Multi-timeframe analysis starts with the overall view and gradually narrows down to the trade. Through each step, traders gain more detail, helping them understand the market before deciding whether a trade suits their strategy.
Step 1: Read Trend Direction Across Multiple Timeframes
First, start with the higher timeframe to see if the market is:
- Moving upward
- Moving downward
- Moving sideways
For instance, if the daily chart is in an uptrend, traders can keep that in mind while checking the smaller timeframes. This helps them understand the current market situation instead of trying to anticipate the next price move.
Step 2: Identify Key Support and Resistance
Now, mark important support and resistance areas. Support is the level where buying has shown up in the past, while resistance is the level where selling has shown up. Begin by marking these levels on the higher timeframe, then look at the smaller timeframes to see how price behaves around them.
Step 3: Analyze the Intermediate Timeframe
Next, move to the intermediate timeframe, which connects the overall view with the actual entry point. For instance, the daily chart may reveal an uptrend, while the 4-hour chart displays a pullback toward support. This helps traders see more clearly what’s happening within the broader trend.
Step 4: Find an Entry on the Lower Timeframe
When the trend and setup are clear, shift your focus to the lower timeframe for an entry. At this stage, the question changes from “What is the market doing?” to “Does the setup match my trading plan?” If the situation on the chart doesn’t match what you were looking for, then it’s better to wait and skip the trade.
Step 5: Define Stop-Loss and Target
Before entering the trade, you need to decide how much risk you can take and where the trade idea no longer works. A stop-loss reduces losses, whereas a profit target decides where you can exit the trade. You need to keep in mind that both should be based on your trading plan rather than choosing randomly.
Which Timeframes Should You Use?
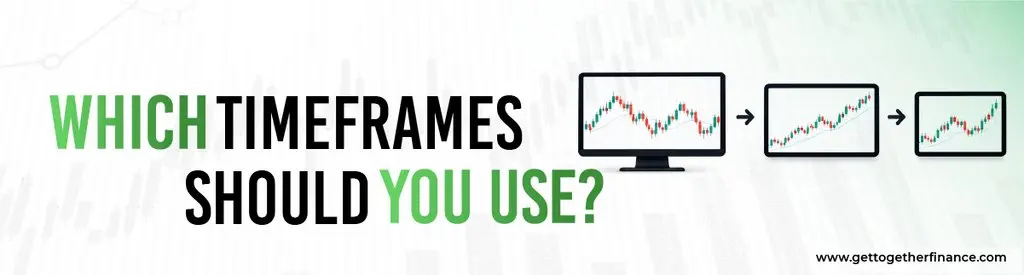
In trading, there is no fixed timeframe combination that traders should use. The combination is based on several factors like strategy, holding period, and the level of market detail the trader needs. Here, the thing you need to note is to choose timeframes that relate to one another clearly.
Daily + 4-Hour + 1-Hour
This combination offers a wide view of the market while still allowing traders to closely look at the setup. The daily chart can display the overall direction, the 4-hour chart helps track the setup as it forms, and the 1-hour chart can help sharpen the entry. This structure is suitable for traders who can hold positions for several days or longer.
4-Hour + 1-Hour + 15-Minute
This combination puts more focus on shorter-term trading. The 4-hour chart offers broader context, the 1-hour chart helps examine the pattern, and the 15-minute chart gives more detail on potential entries. As the charts move through shorter periods, traders may notice more constant price swings
1-Hour + 15-Minute + 5-Minute
This combination focuses on short-term price movement. The 1-hour chart gives a wider view, the 15-minute chart helps look at the setup, and the 5-minute chart helps sharpen the entry. However, smaller timeframes can have more short-term fluctuations. That’s why it becomes even more important to stick to your rules, instead of reacting to every candle.
The best combination depends on how long a trader plans to hold their position. That’s why the same multi-timeframe approach is different for a scalper, a day trader, or a swing trader
Multi-Timeframe Analysis for Different Trading Styles

When choosing a timeframe, trading style plays a crucial role. Someone holding a position for a few minutes doesn’t need the same timeframe structure as someone holding a position for several weeks.
Scalping
Scalpers mainly focus on short-term price movement since they hold trades for only a very short time. Depending on their strategy, they might use the 15-minute chart for the broader intraday picture and a 5-minute or smaller chart to strengthen entries. Scalpers need clear rules for entering and exiting trades because price moves quickly on smaller timeframes.
Day Trading
Day traders usually open and close their trades on the same day. A trader might check the 1-hour chart to see the bigger intraday direction, and the 15-minute chart to look at a possible setup. By using both timeframes, traders can better understand the overall intraday movement while having enough detail to identify a potential entry.
Swing Trading
Swing traders usually hold their positions for several days or weeks. They may depend more on daily and 4-hour charts because their trades depend on larger price movements. The higher timeframe helps traders spot the overall direction, while the 4-hour chart helps find possible setups within that trend.
Position Trading
Position traders hold their trades for longer periods, so they can focus on the bigger picture of the market. For this type of trading, looking at weekly and daily charts is more helpful than very small charts like 5-minute or 15-minute charts. However, the exact combination of timeframes depends on 2 things: the trader’s strategy and how they decide on an entry point. This is why there is no single “best” timeframe. Traders should choose timeframes that support their trading plan and decision-making.
Let’s understand how these timeframes work together through a simple hypothetical trading example.
Multi-Timeframe Trading Example

Here’s a simple hypothetical example to help you understand how multi-timeframe analysis works in practice. The trader begins with the overall view, then moves to smaller timeframes to study the setup and improve the entry point.
Higher-Timeframe Market Structure
Let’s say a trader is studying a stock that’s moving upward. On the daily chart, the price keeps making higher highs and higher lows, showing that the trend is upward. Also, the trader spots a key support level below the current price. Rather than jumping into the trade, they move to the next timeframe to see how price is behaving within this bigger trend.
Intermediate-Timeframe Setup
On the 4-hour chart, the stock has moved back down near the support zone. By now, the trader isn’t only wondering if the stock is moving upward. They’re focused on how price behaves near this key level, and waiting for their trading plan’s conditions to be met.
Lower-Timeframe Entry
Then, the trader moves to the 1-hour chart to look for a potential entry. The trader may consider entering the trade when the price starts gaining strength, and the movement fits the predefined setup. The lower timeframe helps traders sharpen their entry point, while the higher timeframes give the broader picture.
Stop-Loss and Profit Target
Before getting into the trade, the trader figures out where to book profit and where the idea would fail. This makes risk management an important part of the plan from the start.
But in the real market, signals don’t always match across timeframes. Sometimes, the charts tell different stories.
How to Handle Conflicting Timeframe Signals

When traders check multiple timeframes side by side, they may find that the charts don’t always move in one direction. For instance, the daily chart could show an uptrend while the 1-hour chart shows a fall. Here, neither chart is incorrect; they’re just showing price action over different timeframes.
A short-term drop can occur even within a larger uptrend, just as a short-term bounce can occur in a downtrend. In these situations, traders can use the higher timeframe to understand the bigger picture and the lower timeframe for specific trading decisions. Also, they should stop changing timeframes just to find a signal that supports their thinking. Always set your timeframe plan before you analyse the trade. When traders understand how the timeframes connect, they can use tools like support, resistance, and market structure to look at price movements more closely.
Multi-Timeframe Analysis Using Support, Resistance and Market Structure

There are some tools, like support, resistance, and market structure, which assist traders in understanding price movements across different timeframes. For instance, if you’re planning to hold a trade for several days, a support level on the daily chart is more important than a small support level on a 5-minute chart.
Market structure isn’t always the same across timeframes. A stock could still be going upward on the daily chart, but on a smaller chart, it shows lower highs and lower lows during a short-term pullback. By looking at these movements together, traders can find whether a short-term change is just part of the bigger trend, or a real shift in direction. This stops them from treating every small move as if it’s a whole new trend. Indicators, such as RSI, MACD, moving averages, etc., can give traders extra useful information, but the same signal doesn’t mean the same thing on every timeframe.
Multi-Timeframe Analysis With Indicators

Through indicators, traders can understand price movement on different timeframes. Traders shouldn’t rely on indicators alone, because their readings can shift from chart to chart. Also, they should pay attention to price action and the overall market direction.
Moving Averages
They remove the noise from price movement so traders can see the bigger trend more clearly. Traders might check a moving average on the higher timeframe to understand the bigger trend, and use it on a smaller timeframe to track recent price action. But a crossover on its own isn’t proof of a good trade. Traders should check both price behaviour and the overall setup.
RSI
The RSI shows how strong or weak recent price moves have been. Since the daily chart and the 15-minute chart track price changes over their own time periods, their readings differ. Therefore, traders should read the RSI based on the specific timeframe they’re looking at, instead of relying on just one reading.
MACD
It compares moving averages to help traders spot shifts in price momentum. A positive signal on a small chart could just be a temporary move, not proof that the whole market trend is shifting. That’s why traders should still check the higher timeframe to confirm small-timeframe signals.
Common Multi-Timeframe Analysis Mistakes

To understand the market properly, multi-timeframe analysis helps traders, but if used incorrectly, it can lead to confusion instead. By avoiding these mistakes, traders can make their analysis more consistent and clear.
Using Too Many Timeframes
When traders analyse too many charts, it becomes difficult for them to understand the overall market direction. Instead, stick to a few key timeframes and give each a clear role, such as improving an entry, identifying the trend, or analysing the setup.
Treating Every Timeframe as Equally Important
Traders need to understand that not every price movement carries the same importance. A small move on the 5-minute chart might not change the overall trend shown on the daily chart. That’s why traders should rely on the higher timeframe for the overall picture and use smaller timeframes when making precise decisions.
Entering Before Higher-Timeframe Confirmation
A trading setup might look good on a smaller chart, but it does not fit the broader market direction. That’s why traders should first check higher timeframes to understand the overall trend and confirm the setup fits their trading plan.
Constantly Changing Timeframes to Find a Signal
If you keep changing charts until a favourable signal appears, you’ll end up making biased decisions. Therefore, traders should look for confirmation rather than assessing price fairly. When a timeframe structure is fixed, it helps keep the analysis consistent and stops unnecessary changes along the way.
If you want to look for a broader view of the market rather than just looking at one chart, multi-timeframe analysis is the best option. But the approach and number of timeframes needed depend on two things: the trader’s style and strategy.
Multi-Timeframe Analysis vs. Single-Timeframe Trading

Traders can analyse the market using either multiple timeframes or a single chart, though multi-timeframe analysis offers a broader view. Both approaches have their own characteristics, and by understanding their differences, traders can choose the best method for them.
| Basis of Comparison | Multi-Timeframe Analysis | Single-Timeframe Trading |
| Market Context | It offers a broader view of market direction and price movements | It focuses on price movements in the selected timeframe |
| Analysis Process | Multi-Timeframe analysis requires a structured process for comparing timeframes | Single-Timeframe trading can be easier to follow with fewer charts |
| Charts Used | It analyses the same market across multiple timeframes | It focuses on one timeframe |
| Trend Analysis | Multi-Timeframe analysis compares short-term movements with the broader trend | Single-Timeframe trading detects trends using a single chart |
| Information Available | It offers additional context from different timeframes | It limits analysis to the information shown on one timeframe |
Multi-timeframe analysis may work for traders who want broader market context before making trading decisions. On the other hand, single-timeframe trading may suit those who like a more focused and simpler way to analyse the market.
Here, the key thing to understand is how the method you choose fits your trading plan instead of thinking that more charts always lead to better decisions.
Multi-Timeframe Analysis Checklist

Before entering a trade, traders should double-check their analysis to make sure the setup matches their trading plan. Here is the checklist that they should use in order to make better decisions.
- Have I reviewed the higher timeframe?
- What is the overall market direction?
- Where are the key support and resistance areas?
- What is going on on the intermediate timeframe?
- Does the lower-timeframe setup fit my trading plan?
- Where will I place my stop-loss?
- What is my target?
- Am I using an appropriate number of timeframes?
- Does the timeframe combination align with my trading style?
- Am I following my plan instead of chasing a signal?
Conclusion
Multi-timeframe analysis helps traders make better-informed decisions instead of depending on just one chart. But its effectiveness depends on two things: risk management and how well traders fit it into their strategy.
Also, traders should remember that no analysis method can remove market uncertainty and guarantee successful trades. By practising regularly and staying consistent, traders can improve how well they read charts and put together a trading process that suits their style, goals, and experience level.
FAQs

What is multi-timeframe analysis in trading?
Multi-timeframe analysis means looking at the same market on different timeframes to understand the bigger trend and find possible trade entries.
What is top-down analysis in trading?
Top-down analysis means moving from higher timeframes to lower timeframes to study the market’s direction, setups, and possible entry points.
How many timeframes should a trader use?
Usually, traders work with two or three timeframes, but how many they use depends on their trading style and strategy.
Which timeframes are suitable for multi-timeframe analysis?
Swing traders may use daily, 4-hour, and 1-hour charts, while short-term traders may use 1-hour, 15-minute, and 5-minute charts.
Can multi-timeframe analysis guarantee profitable trades?
No, multi-timeframe analysis cannot guarantee profits or eliminate trading risks.
Can indicators show different signals on different timeframes?
Yes, indicator readings can differ across timeframes because each uses price data from a different period.



